

Answered step by step
Verified Expert Solution
Question
1 Approved Answer
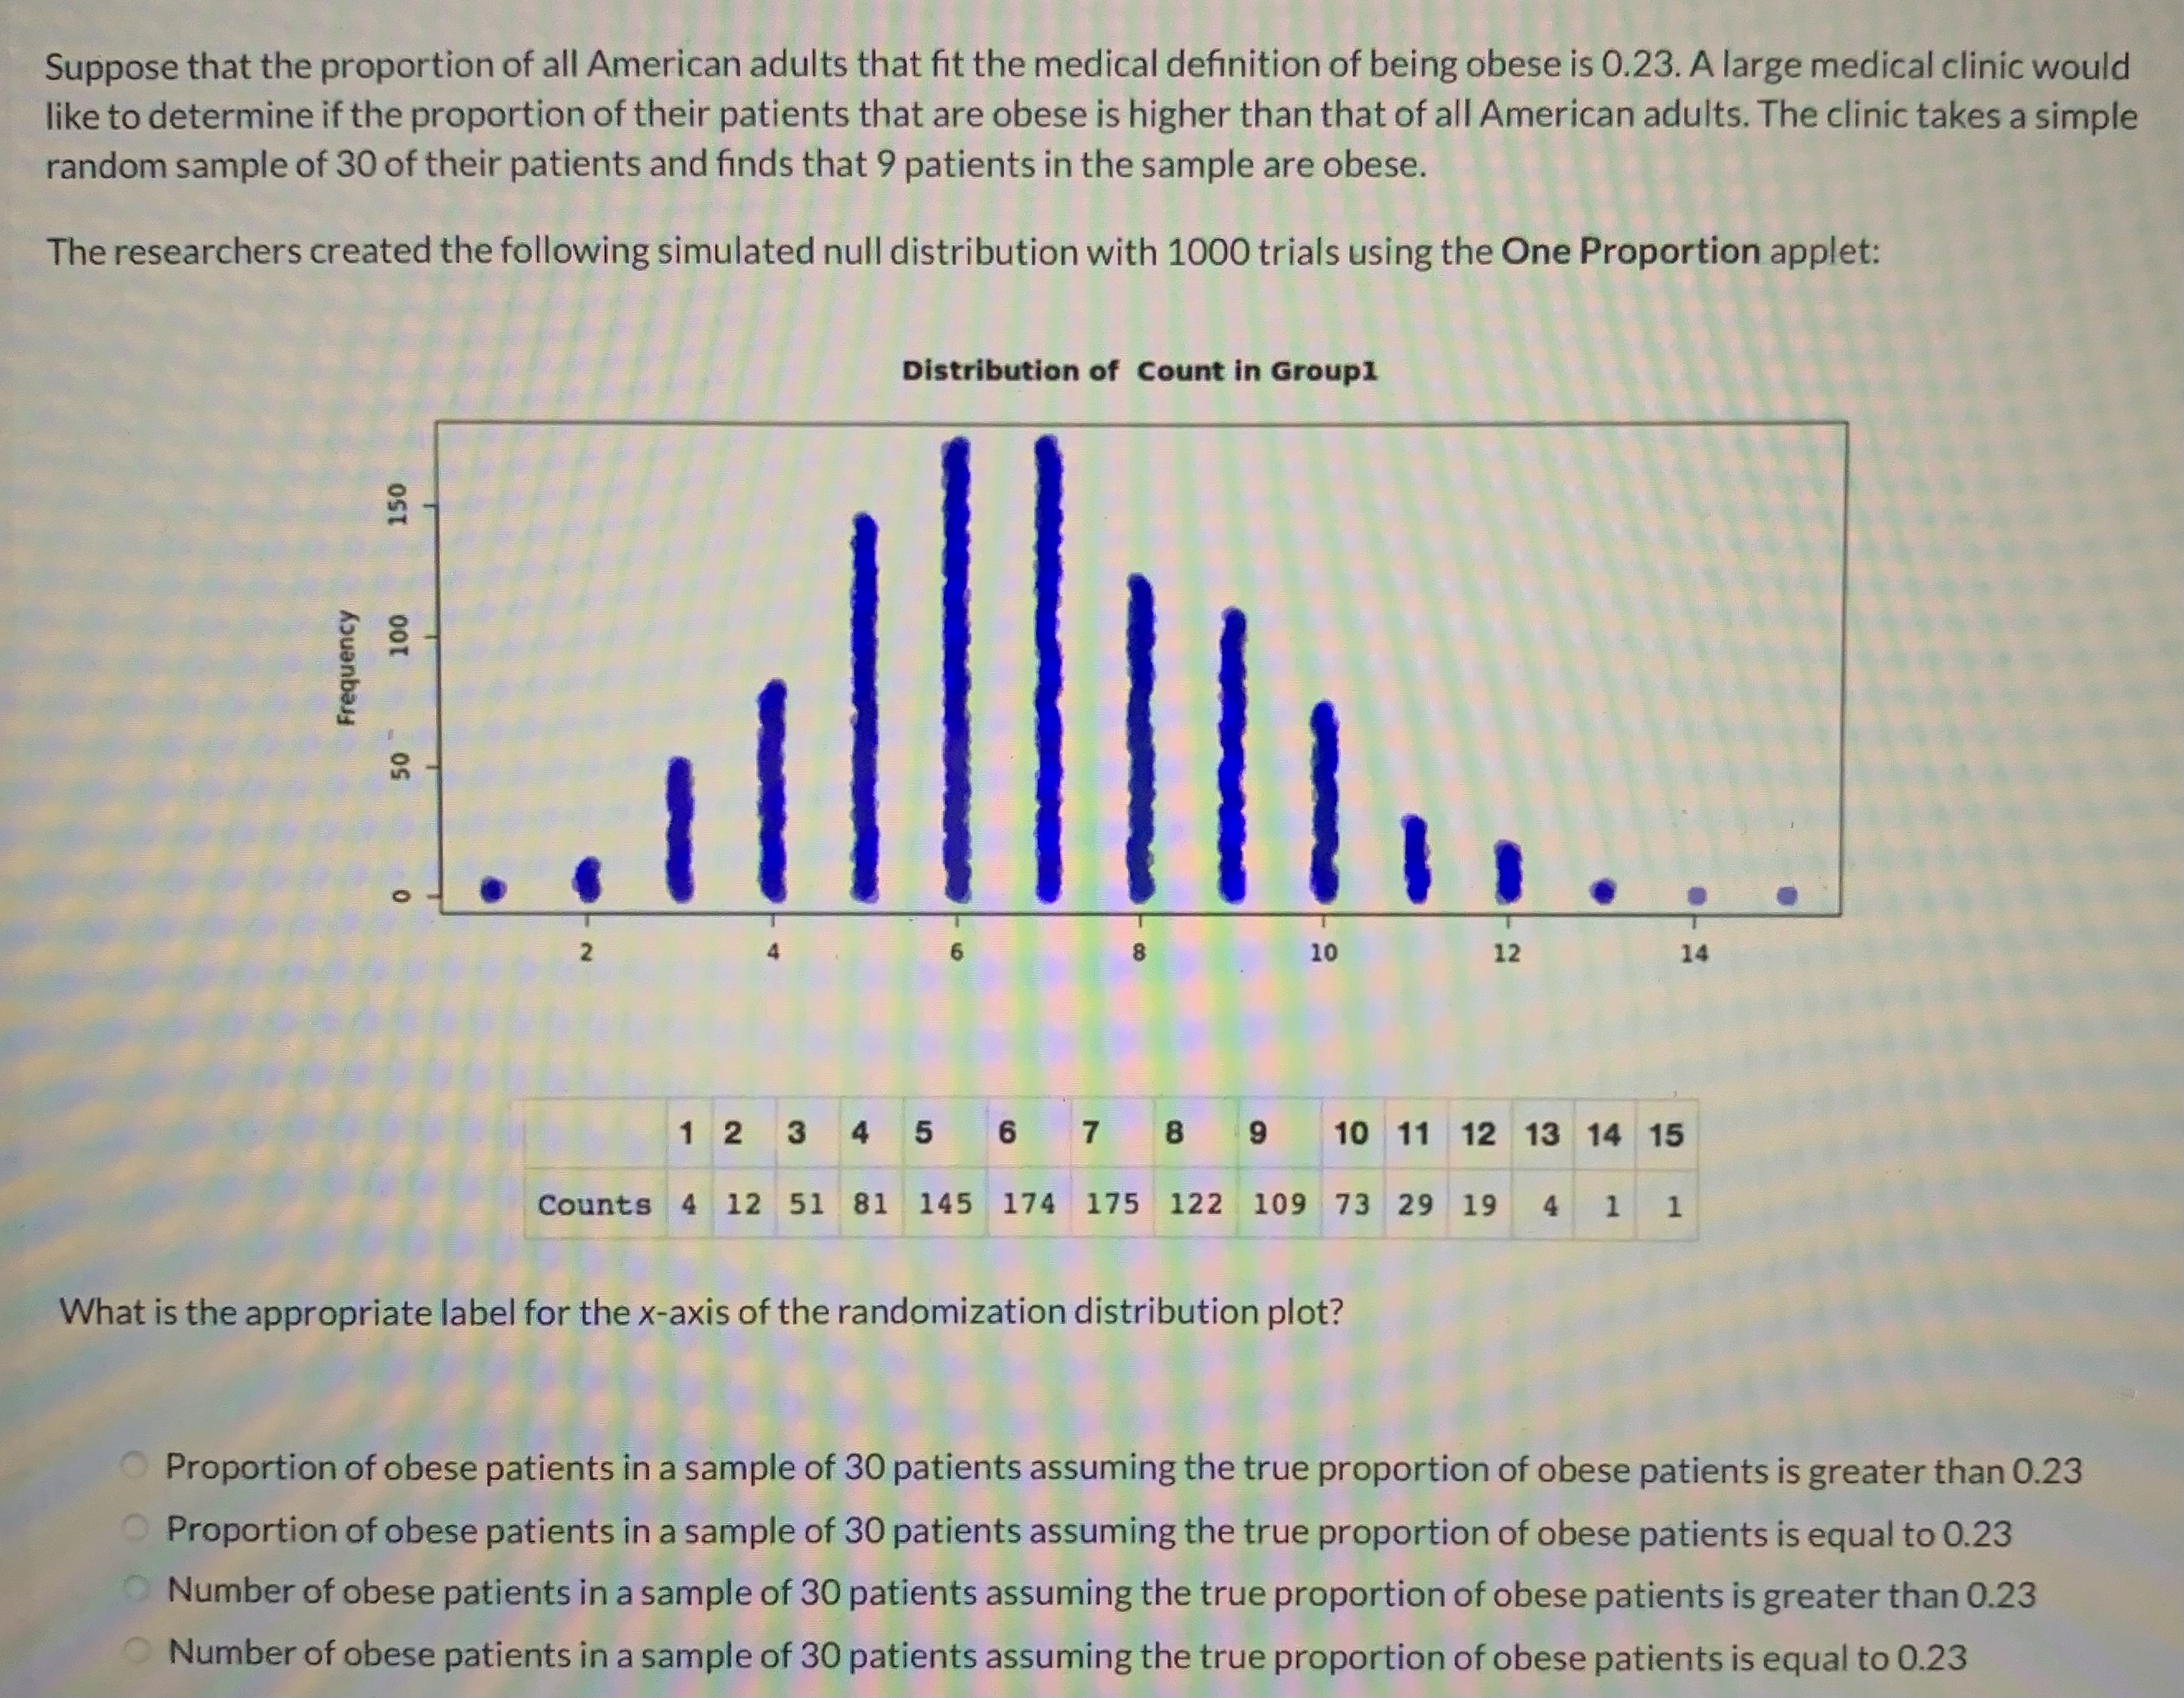
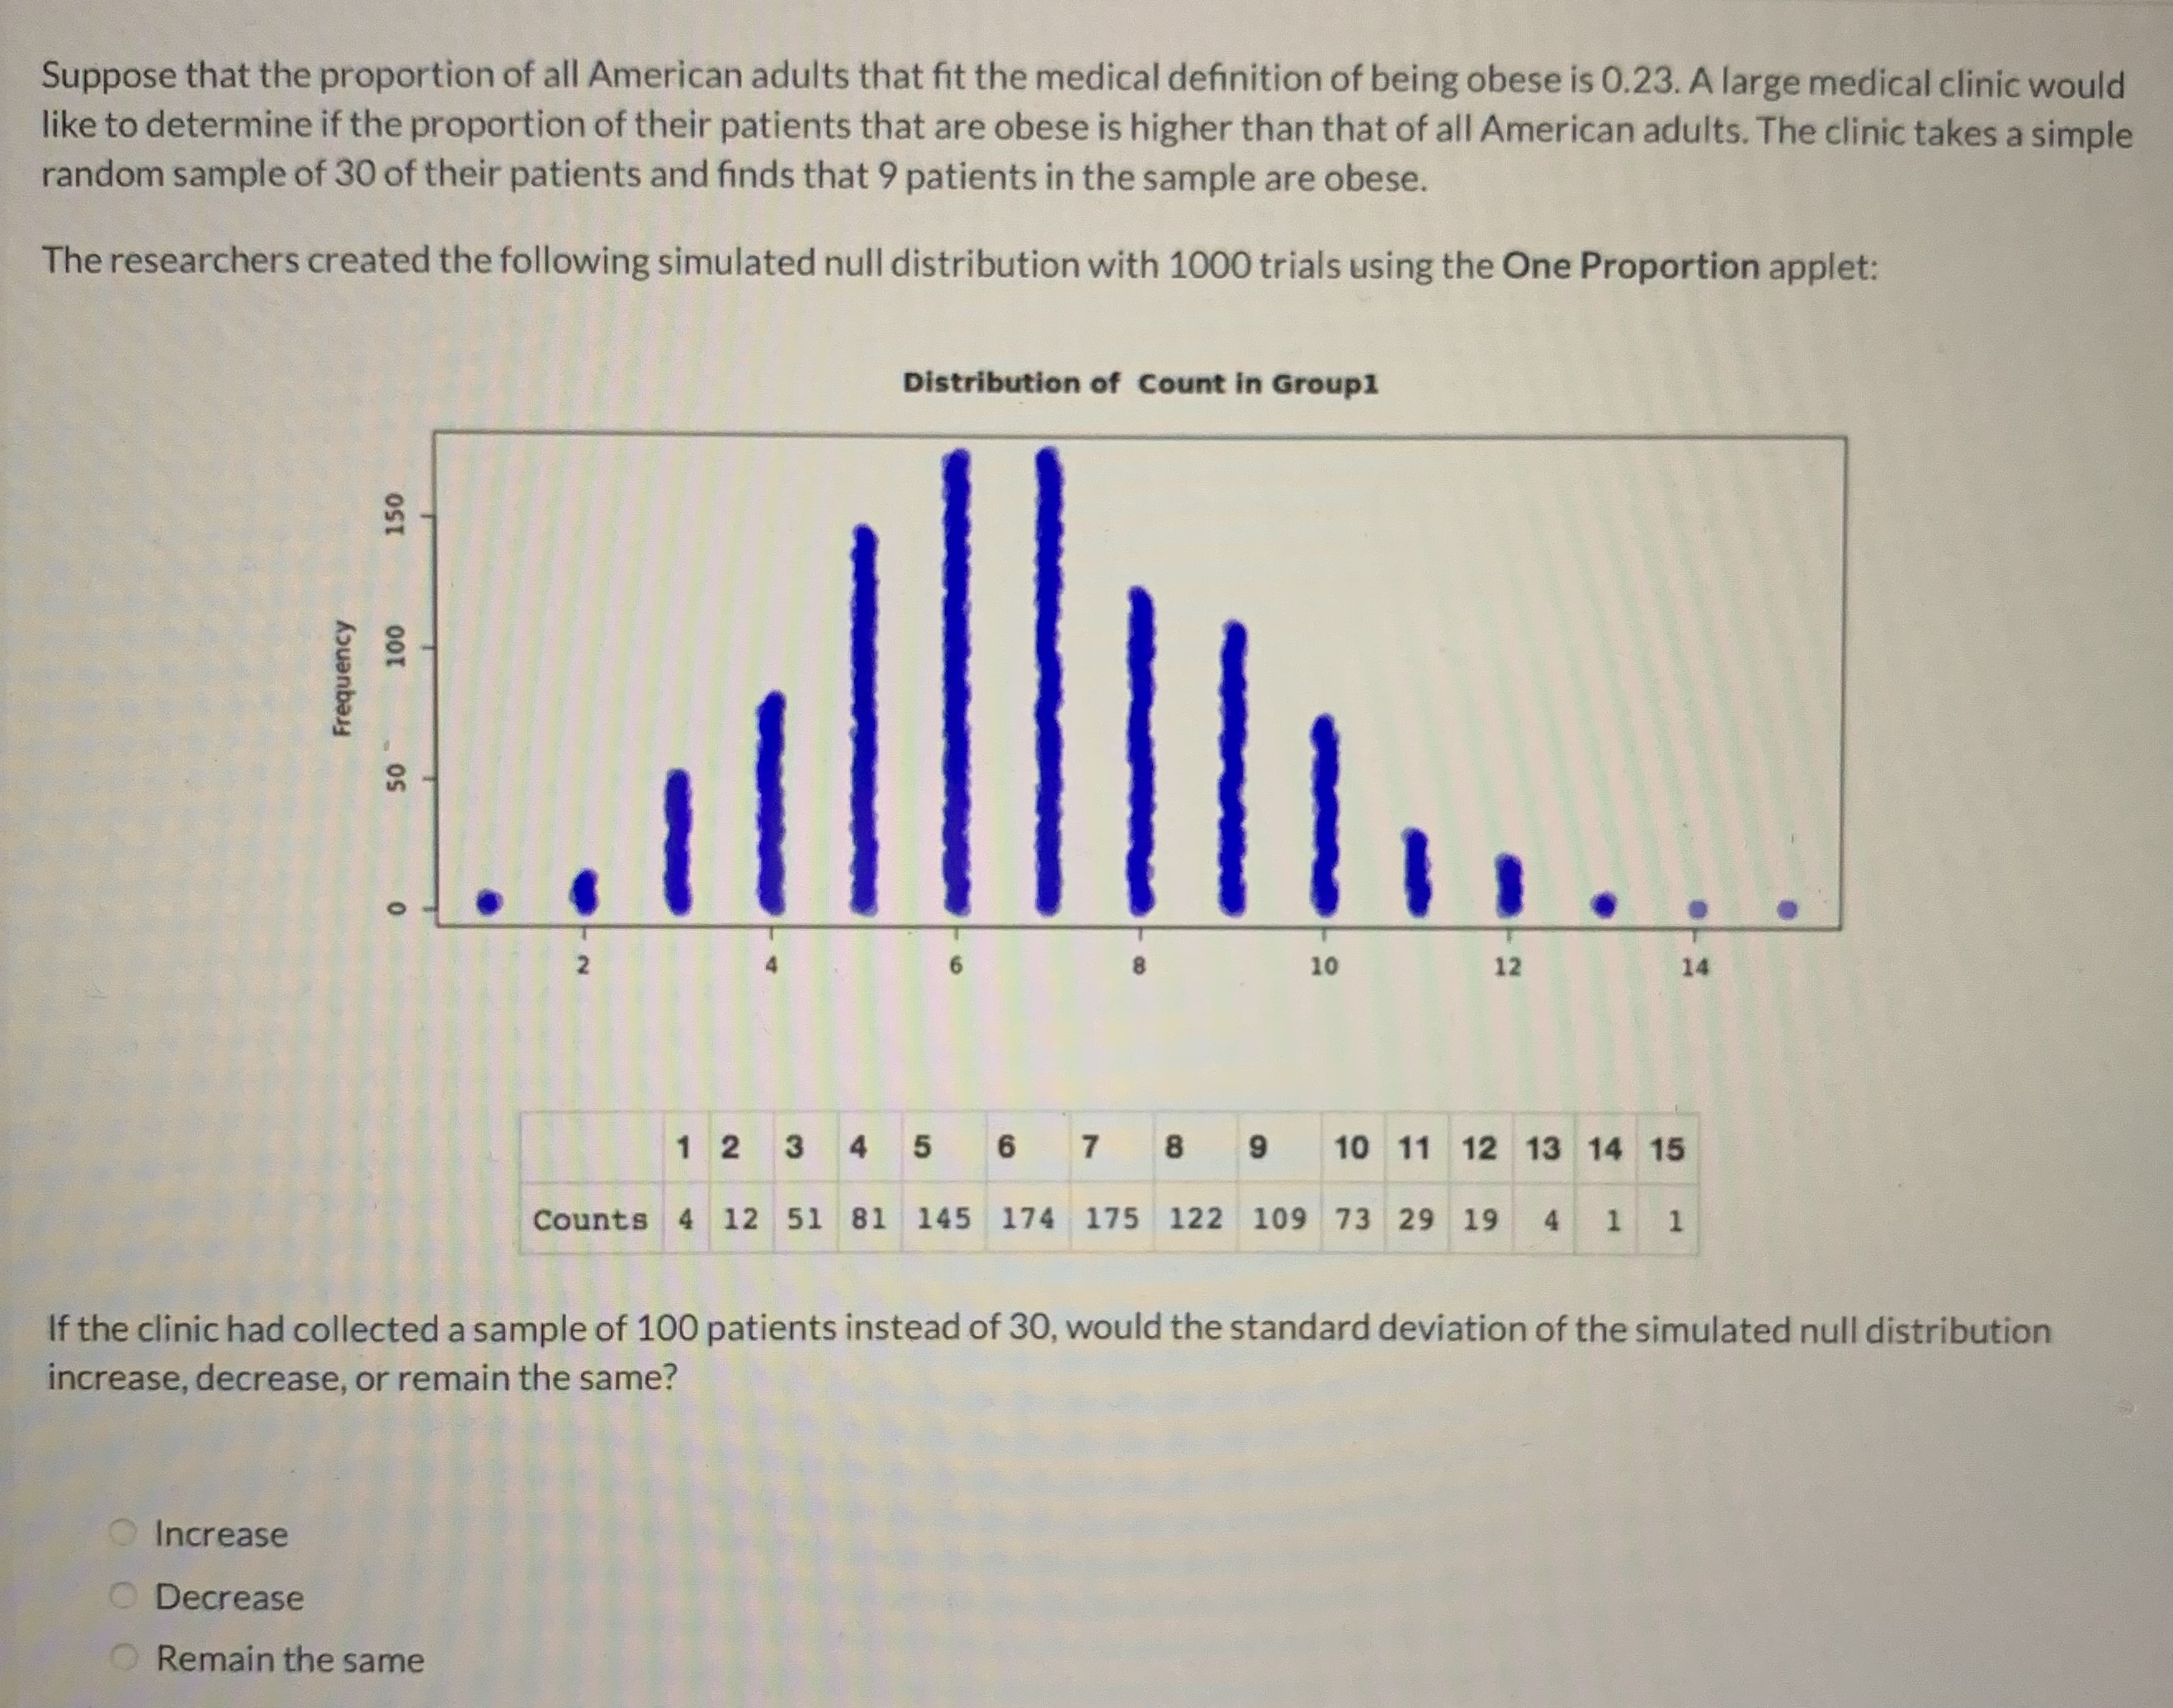
Suppose that the proportion of all American adults that fit the medical definition of being obese is 0.23. A large medical clinic would like to
Step by Step Solution
There are 3 Steps involved in it
Step: 1

Get Instant Access to Expert-Tailored Solutions
See step-by-step solutions with expert insights and AI powered tools for academic success
Step: 2

Step: 3
Ace Your Homework with AI
Get the answers you need in no time with our AI-driven, step-by-step assistance
Get Started
How To Prove It A Structured Approach
Authors: Daniel J Velleman
2nd Edition
0511159439, 9780511159435