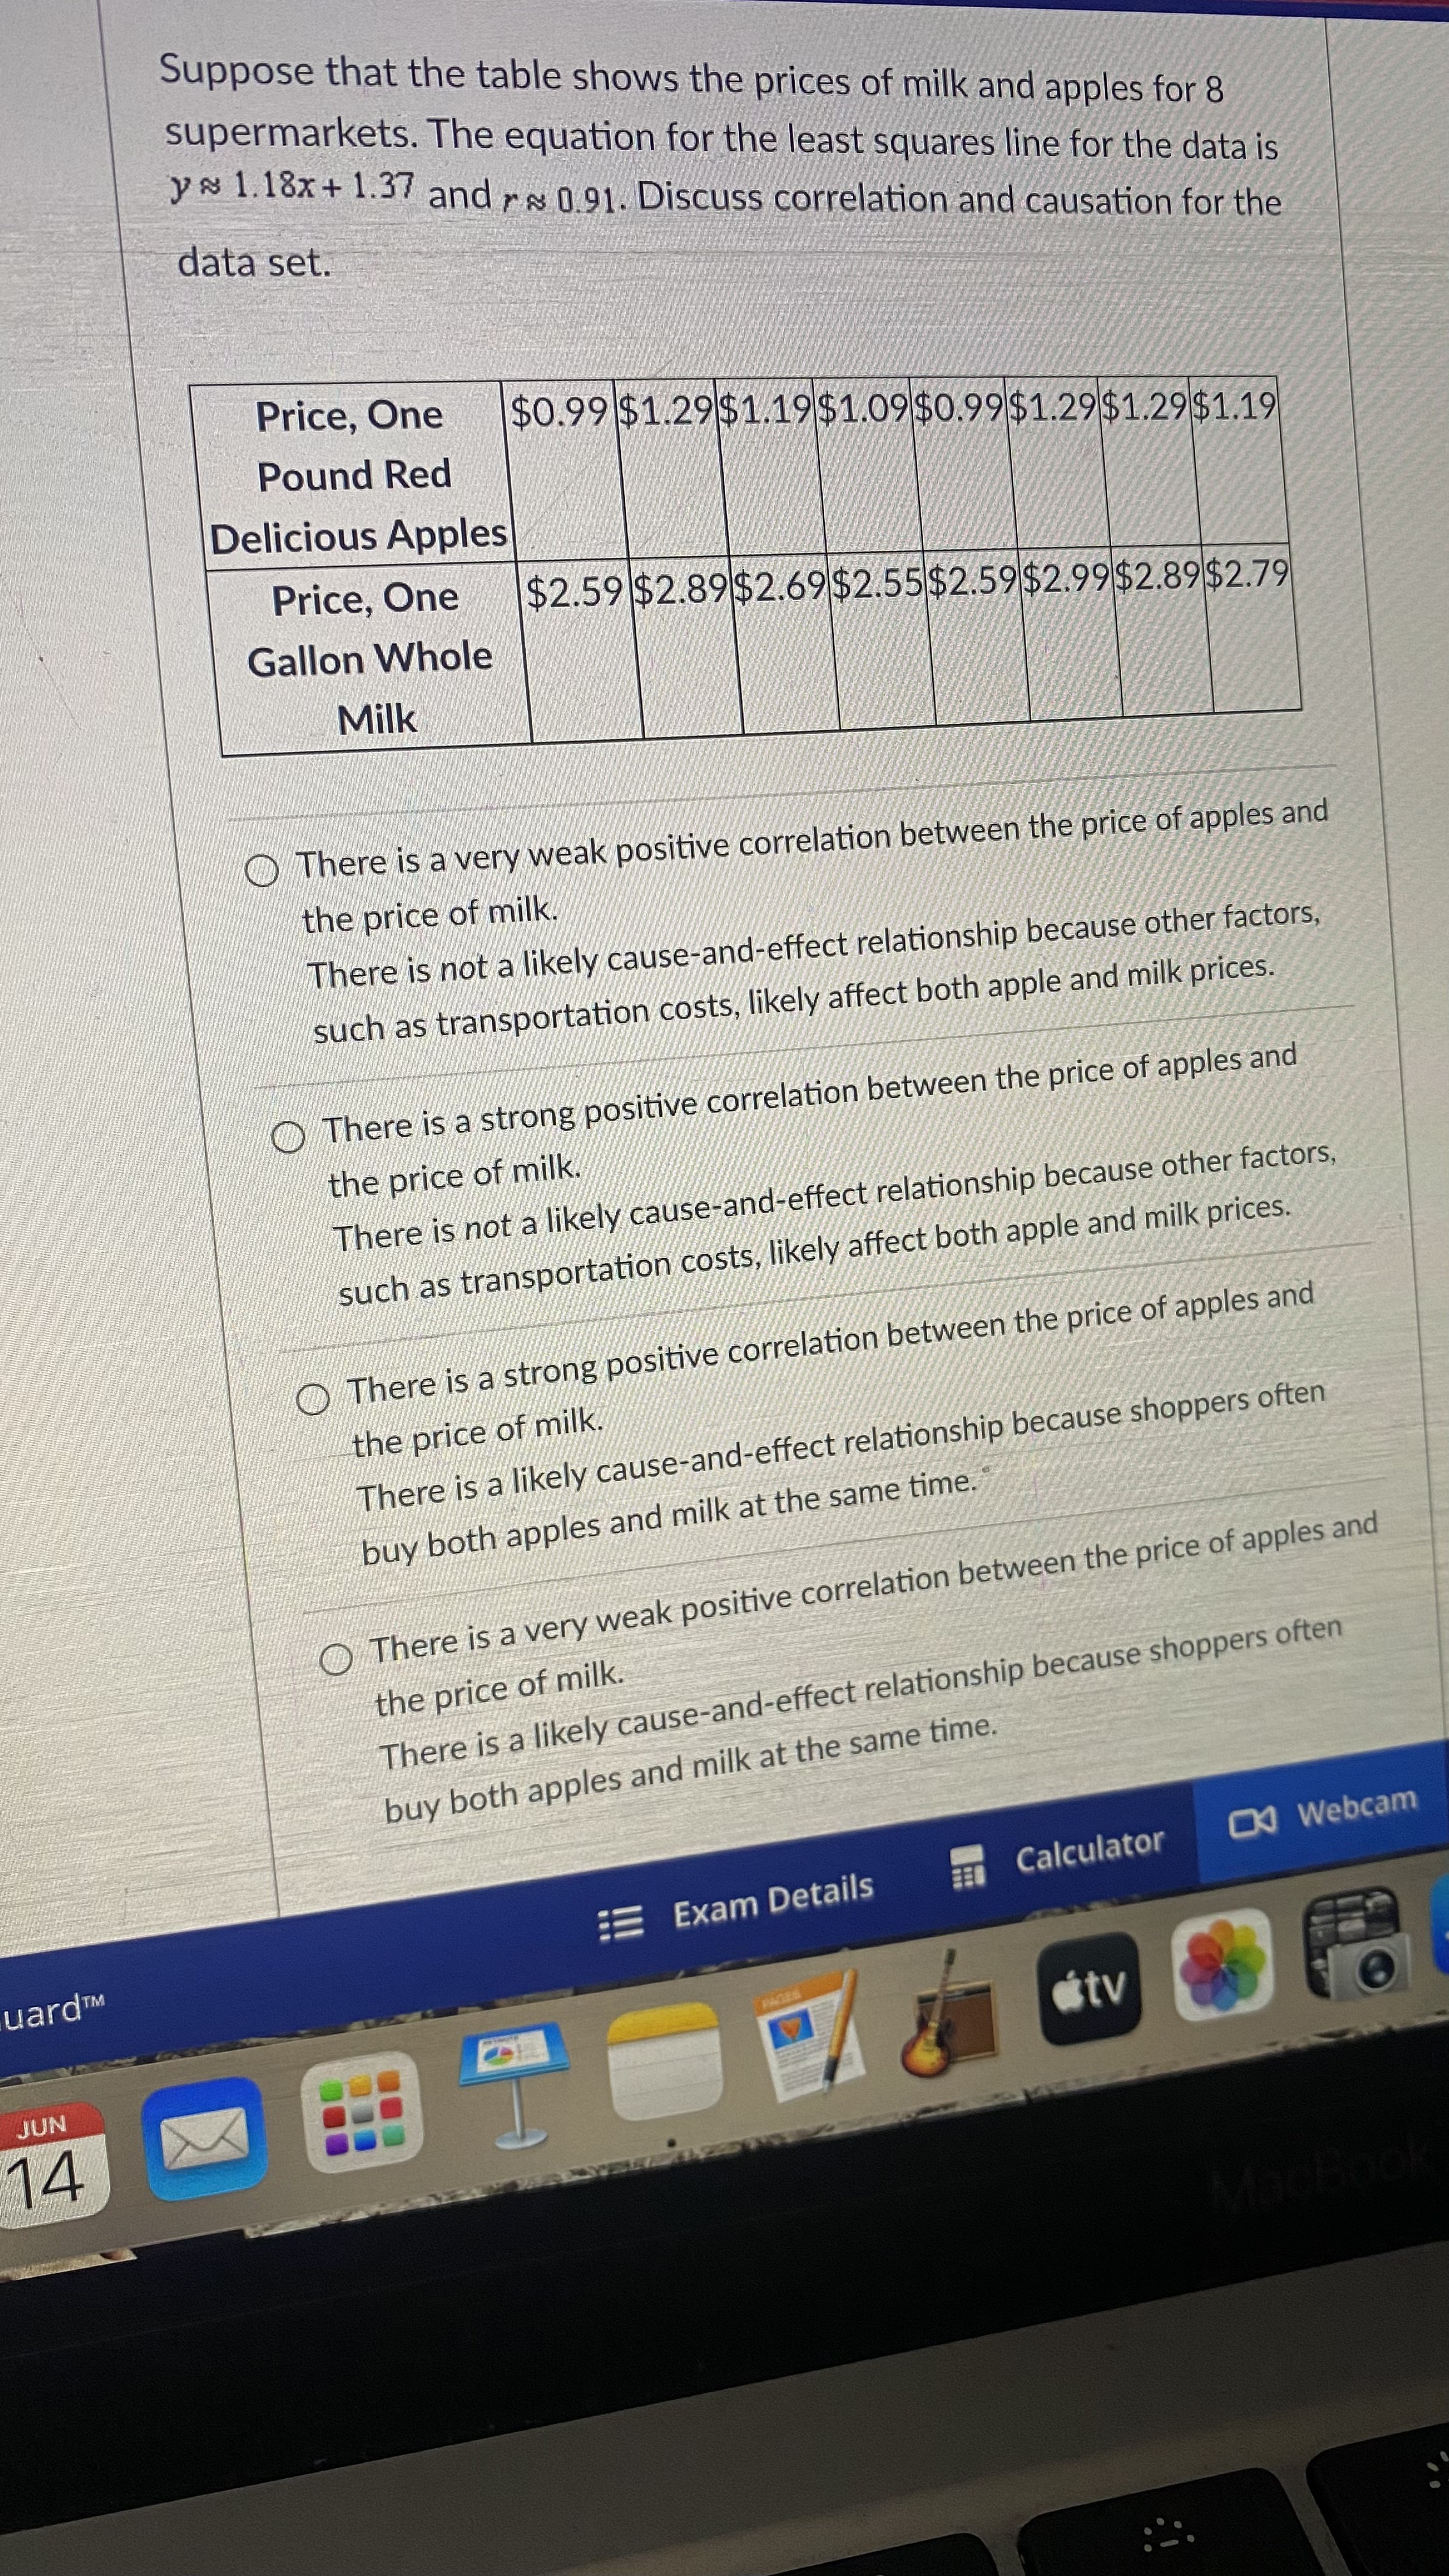
Suppose that the table shows the prices of milk and apples for 8 supermarkets. The equation for the least squares line for the data is
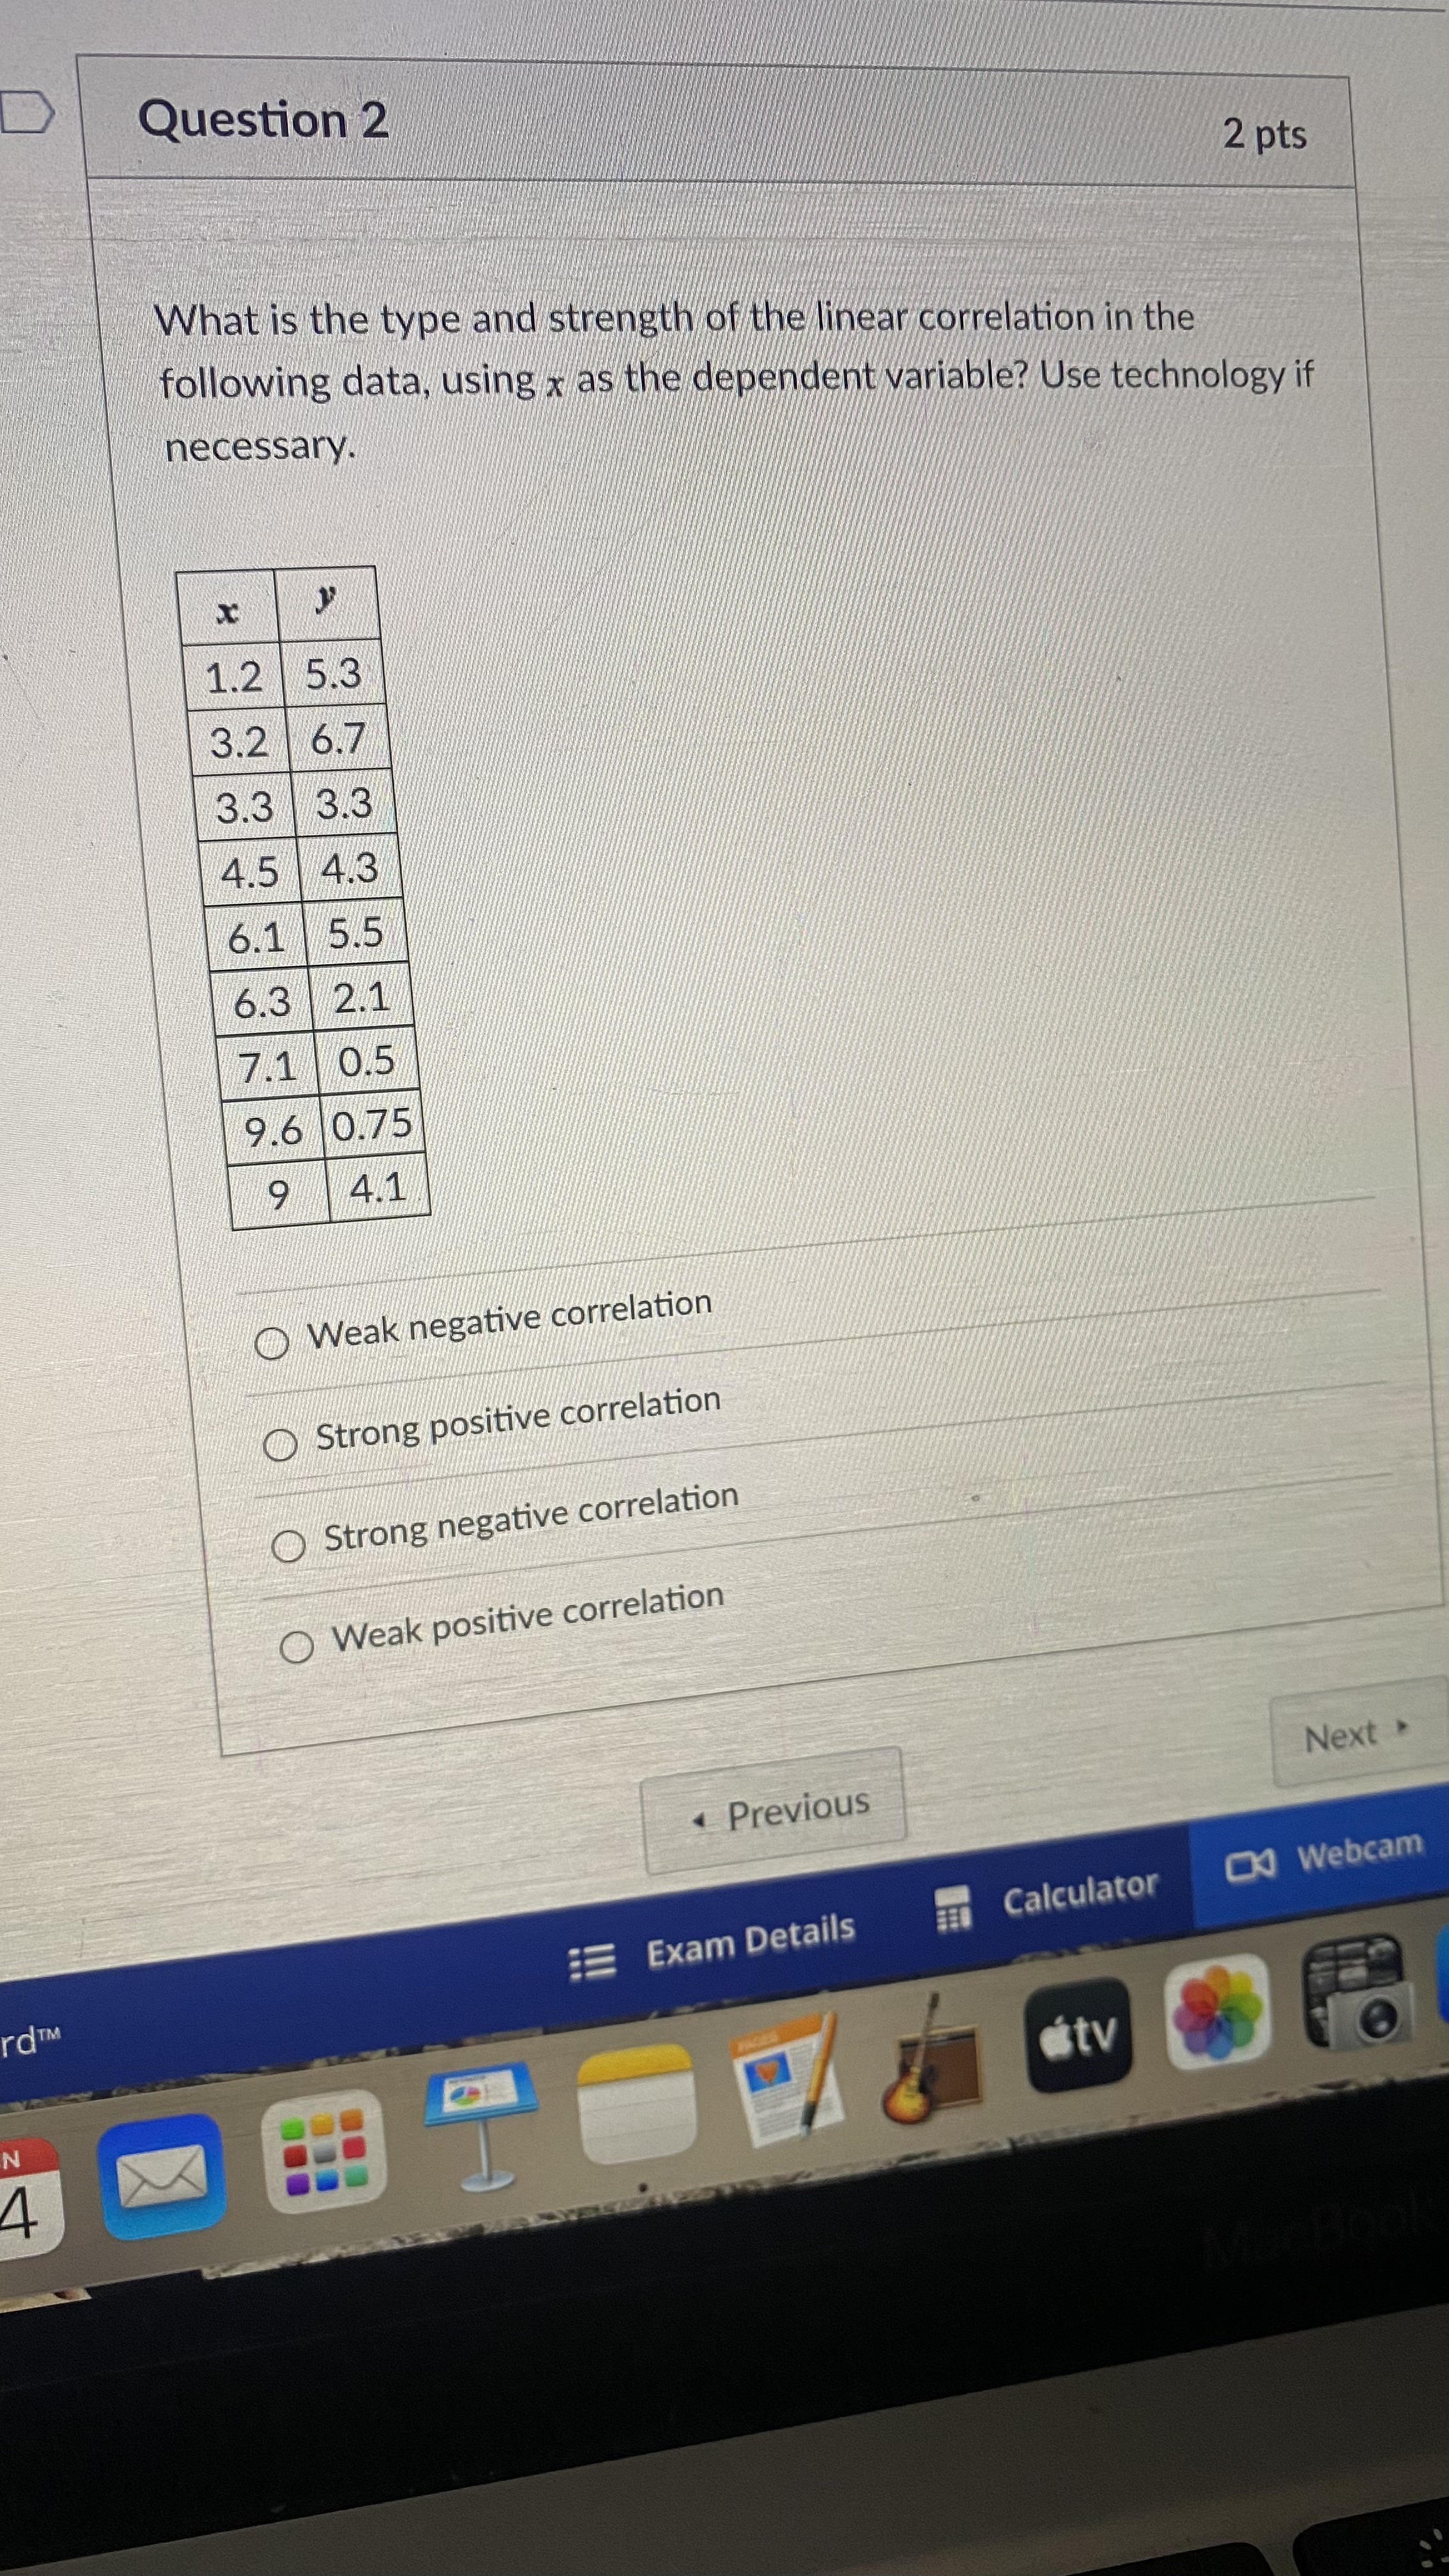
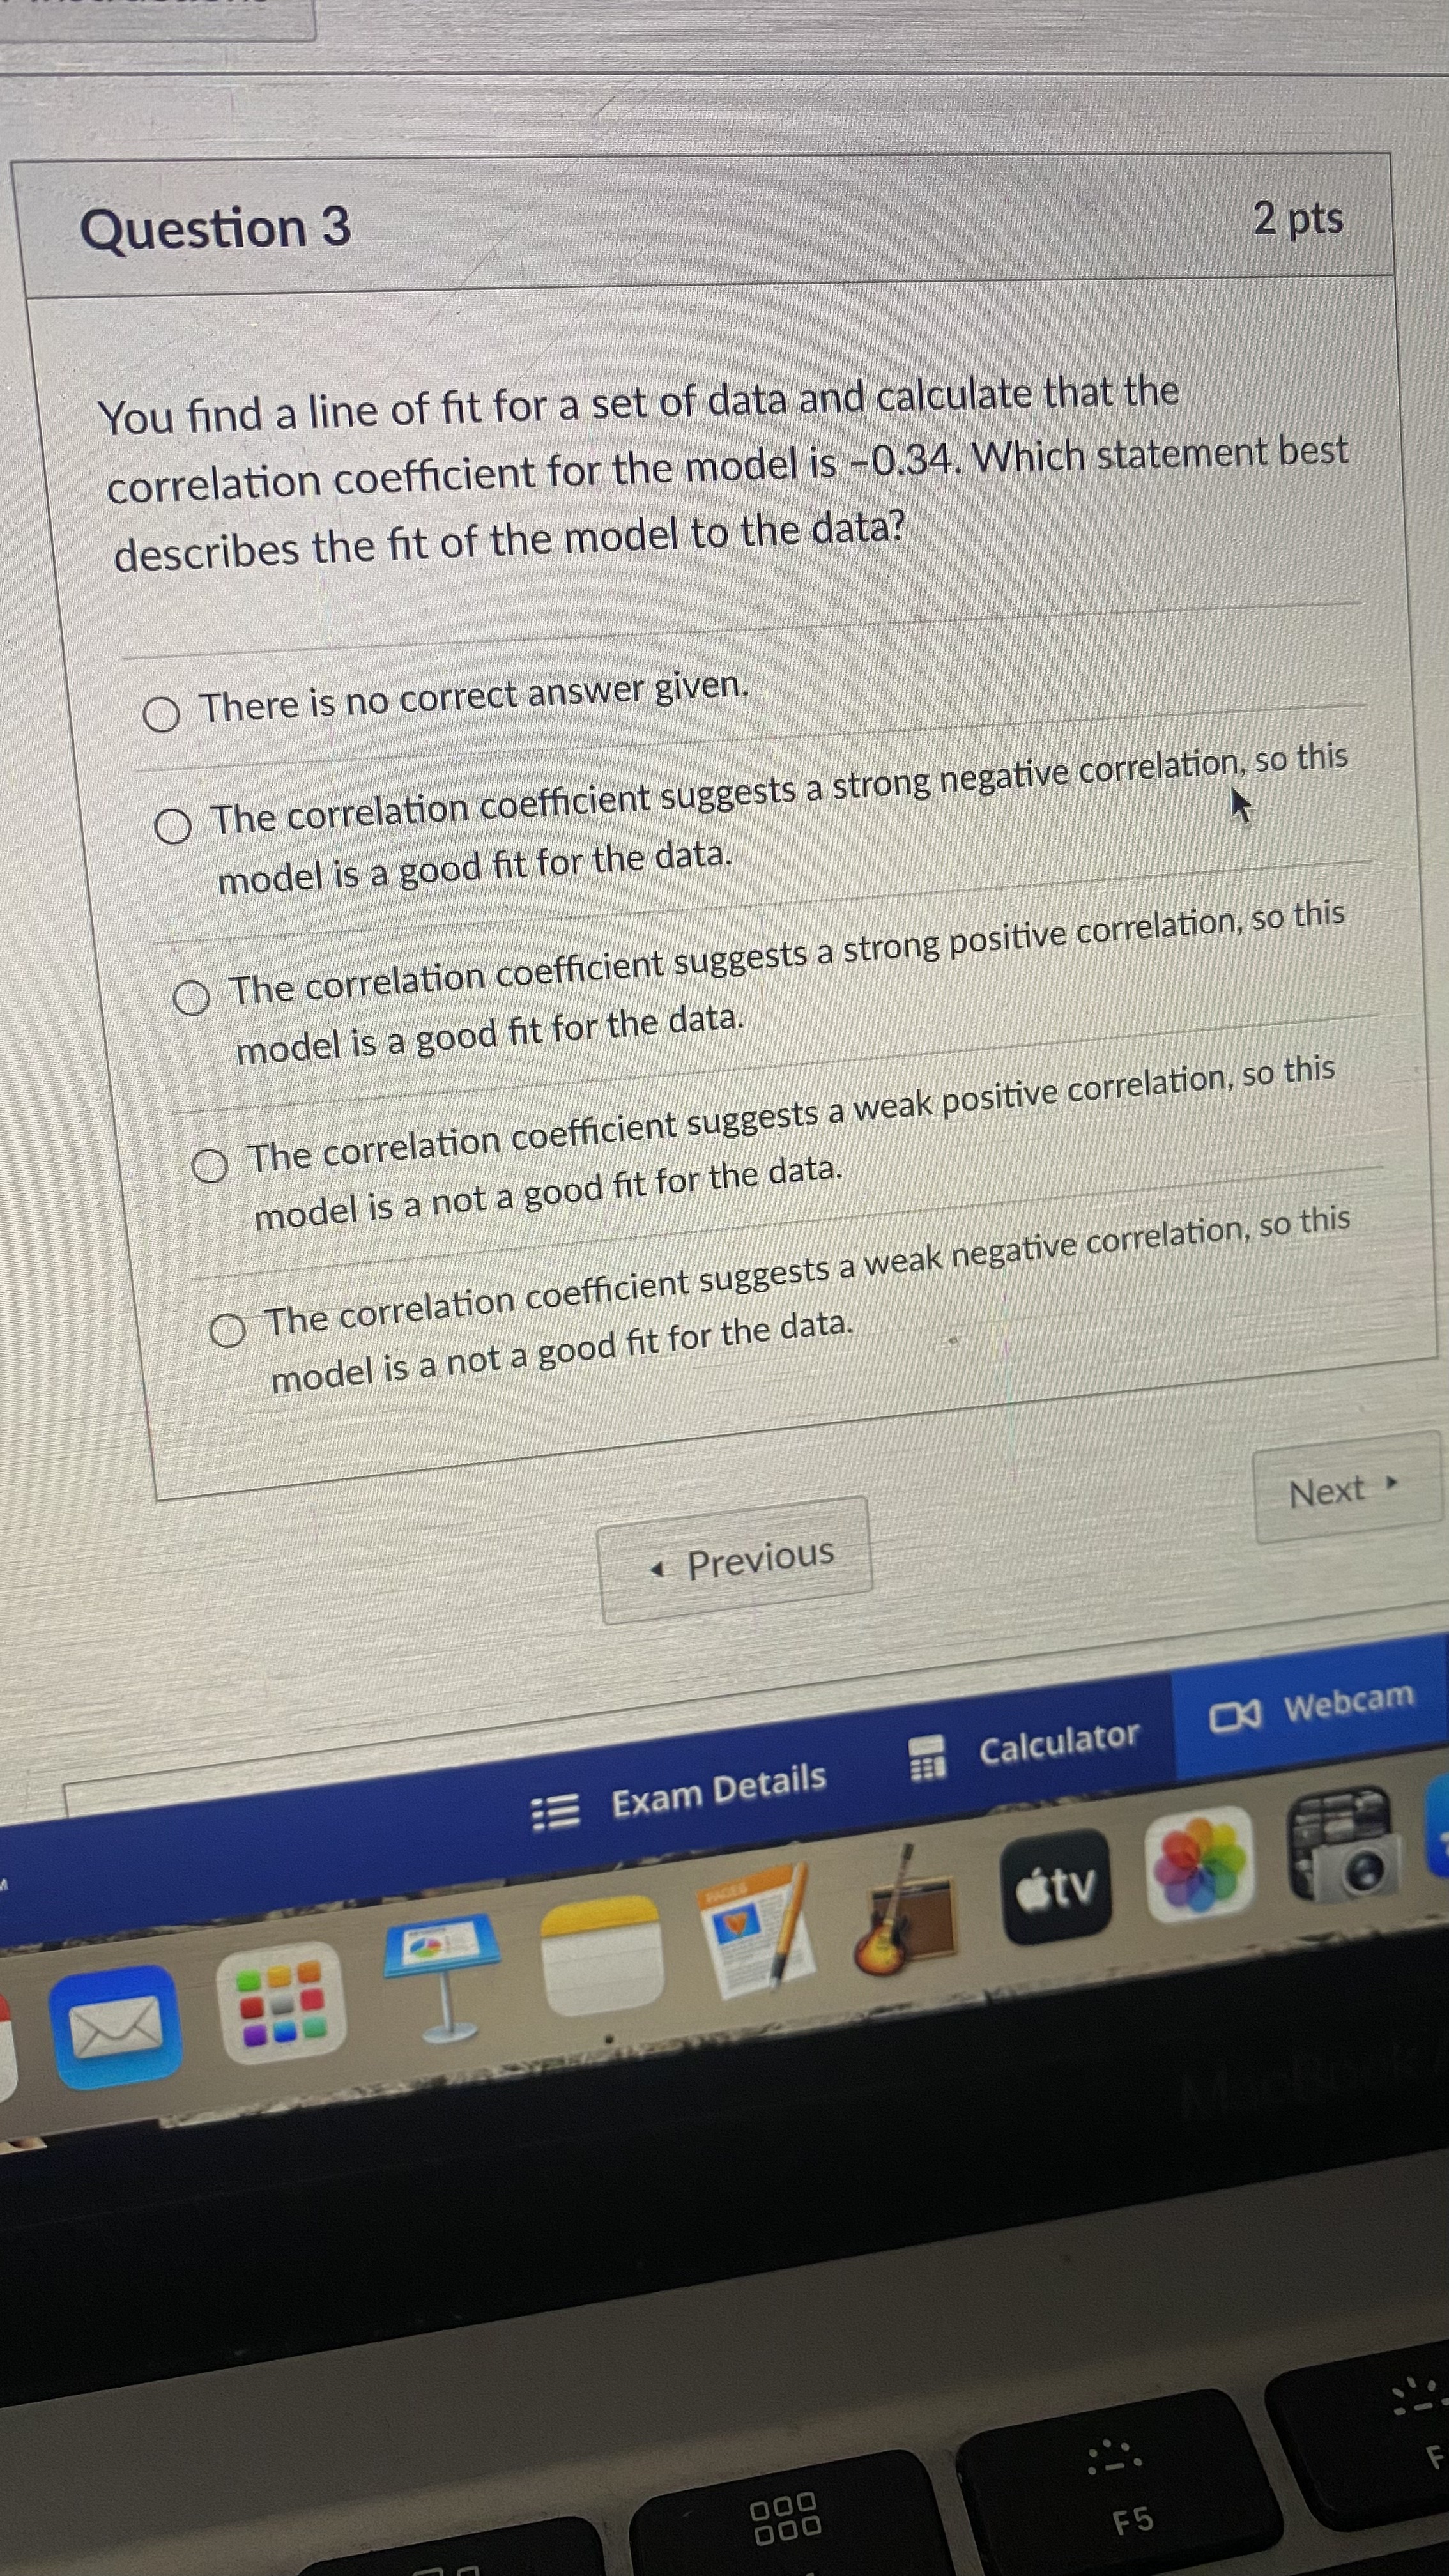
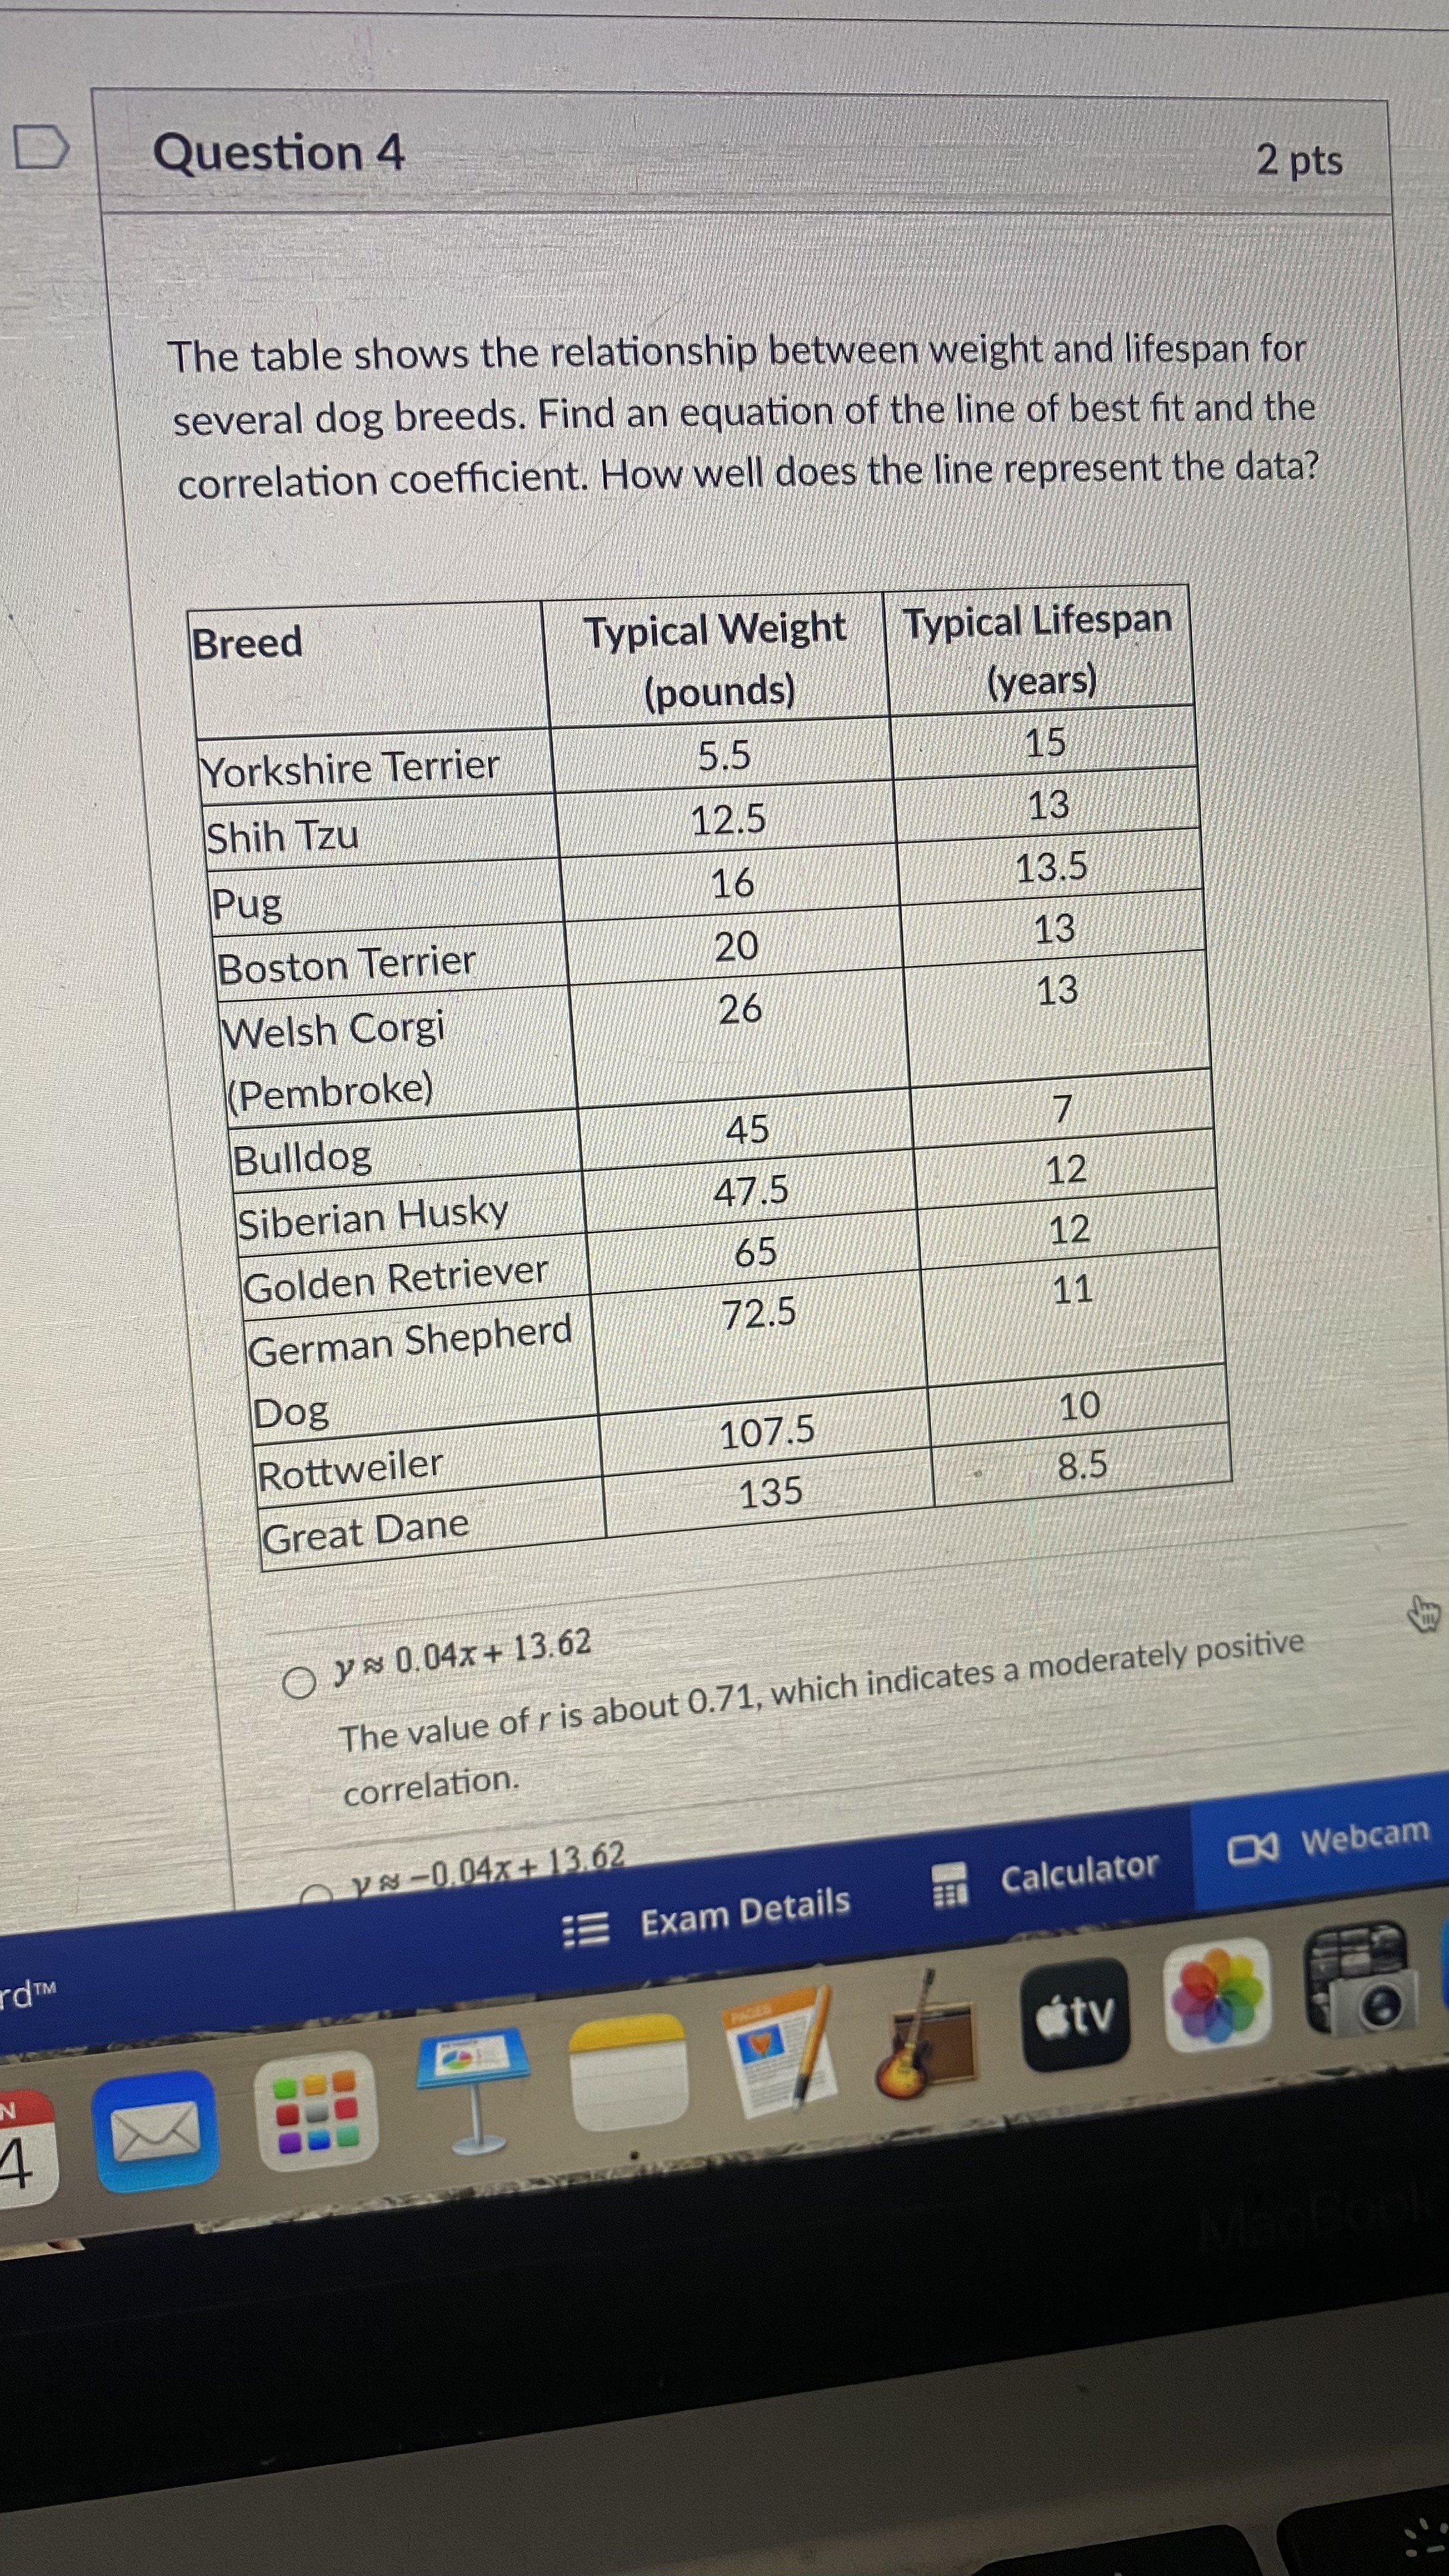
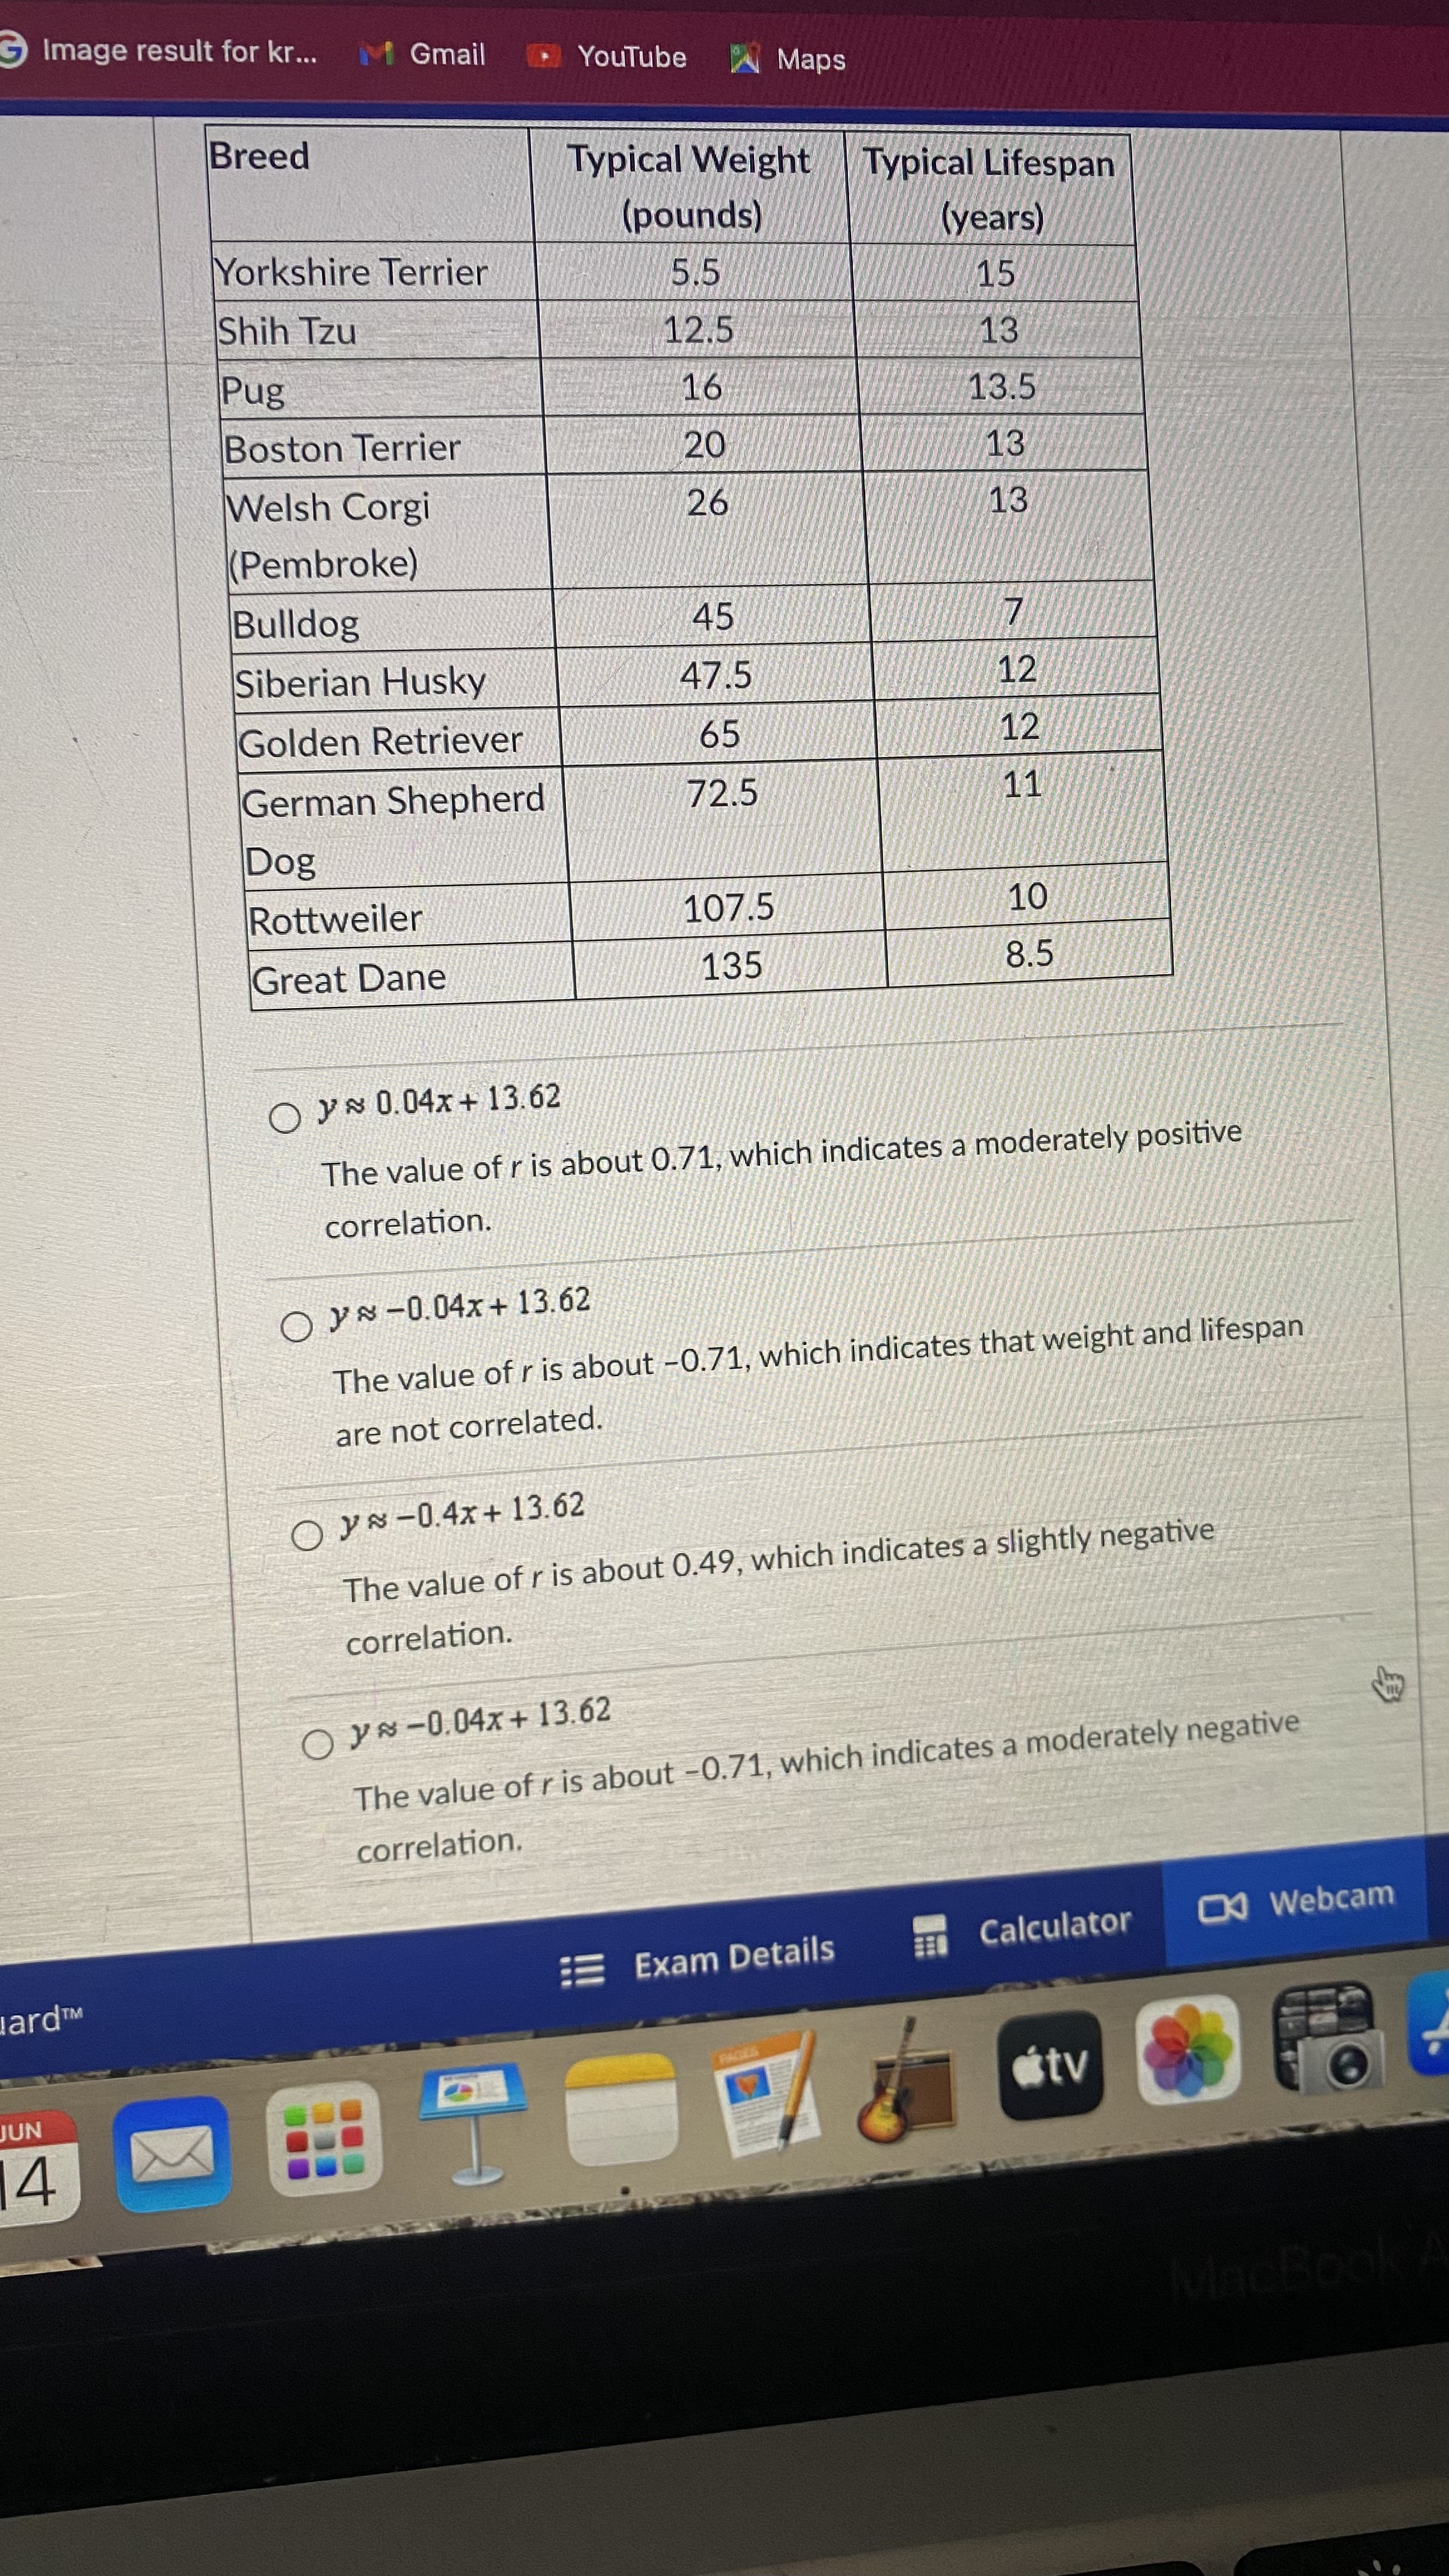
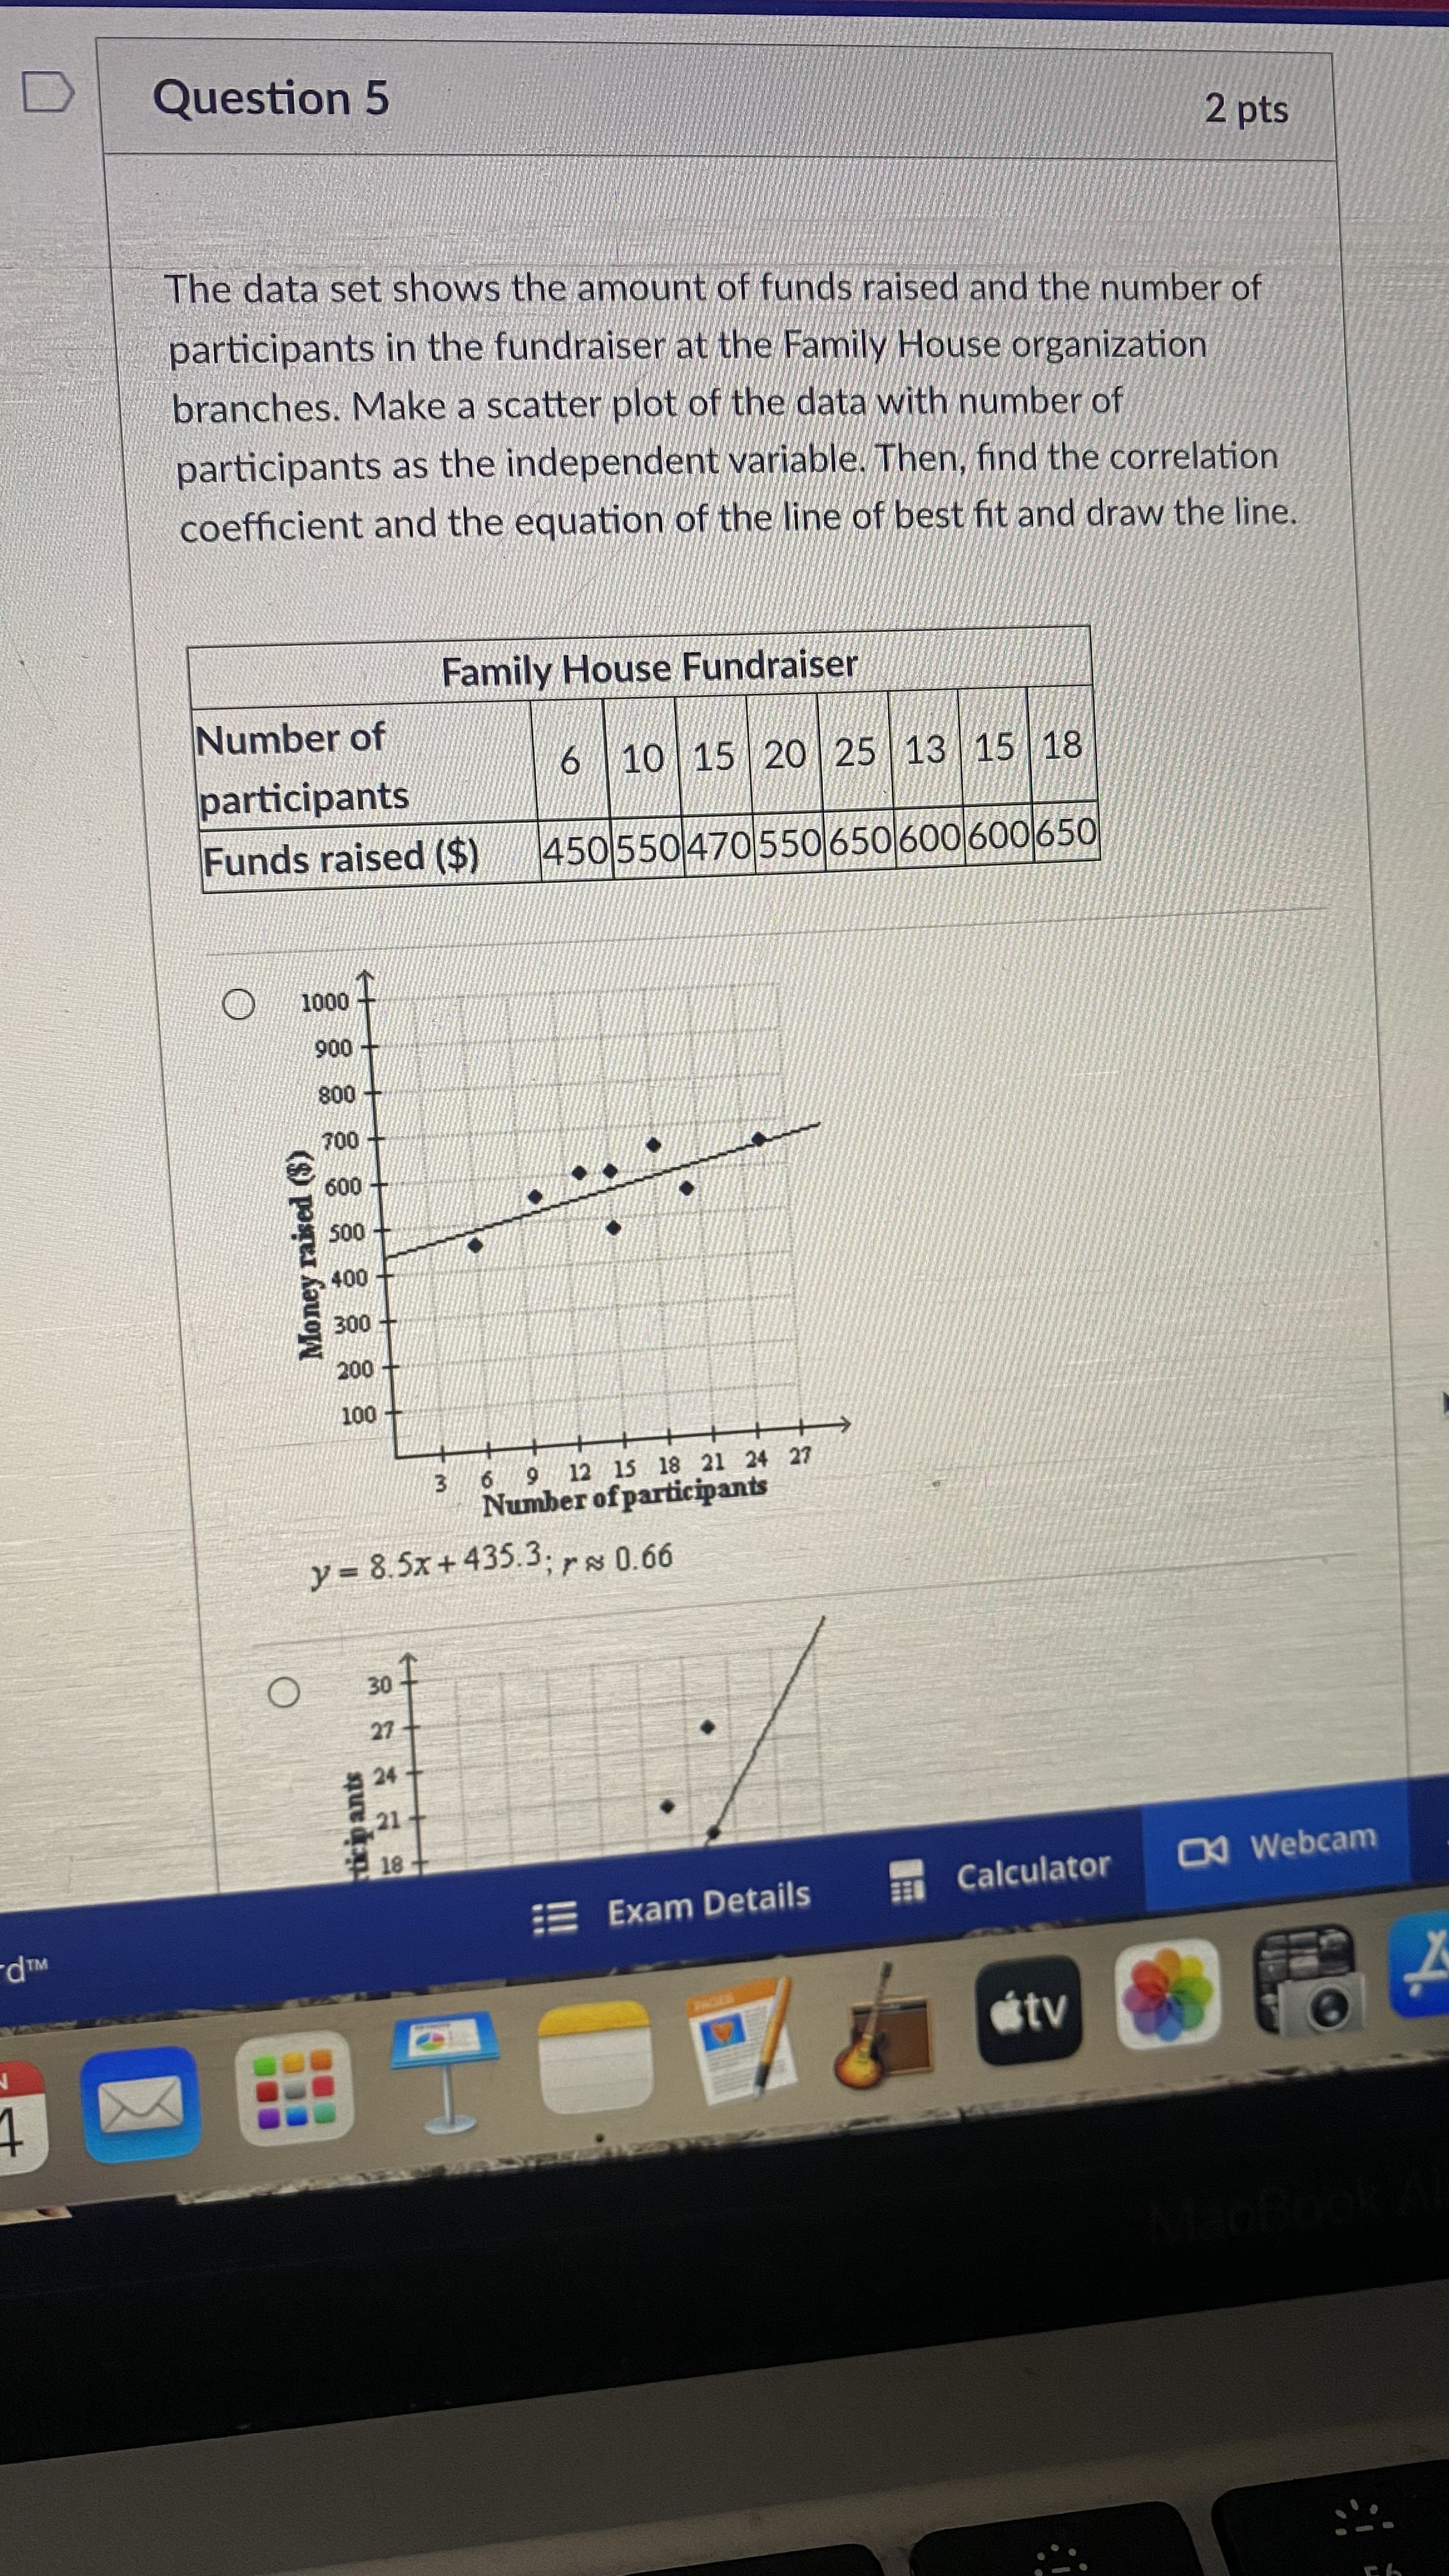
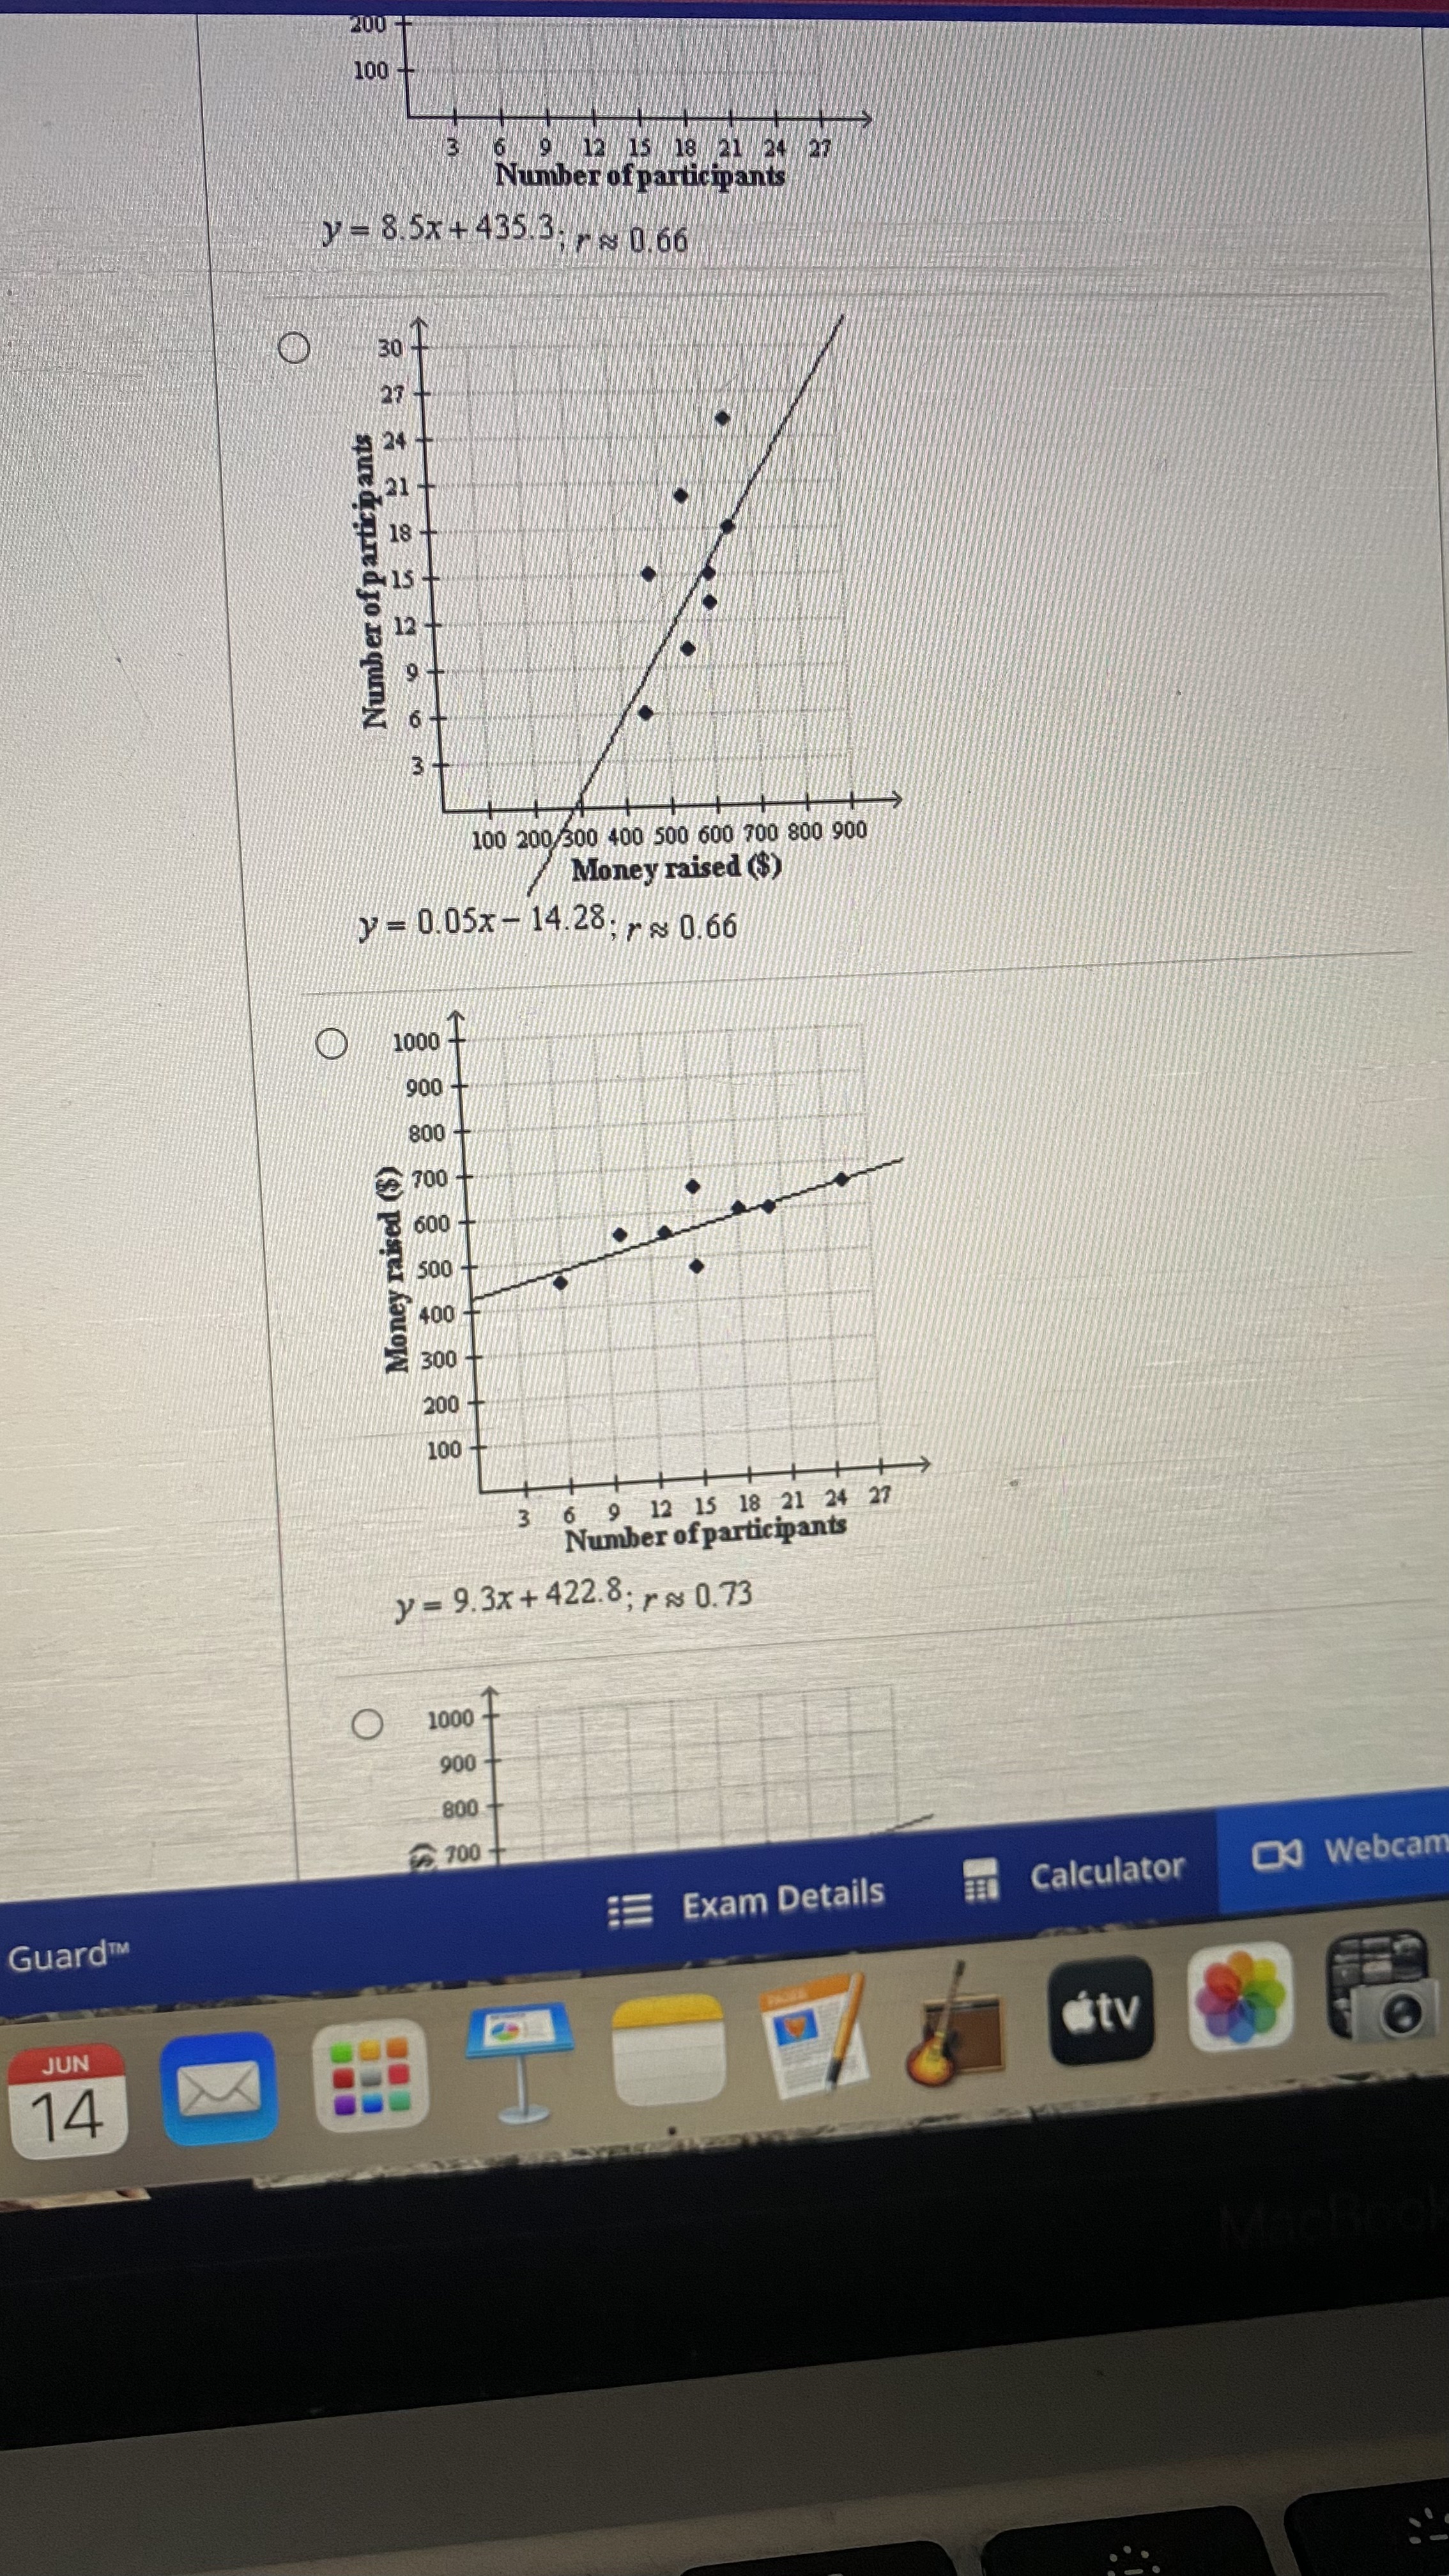
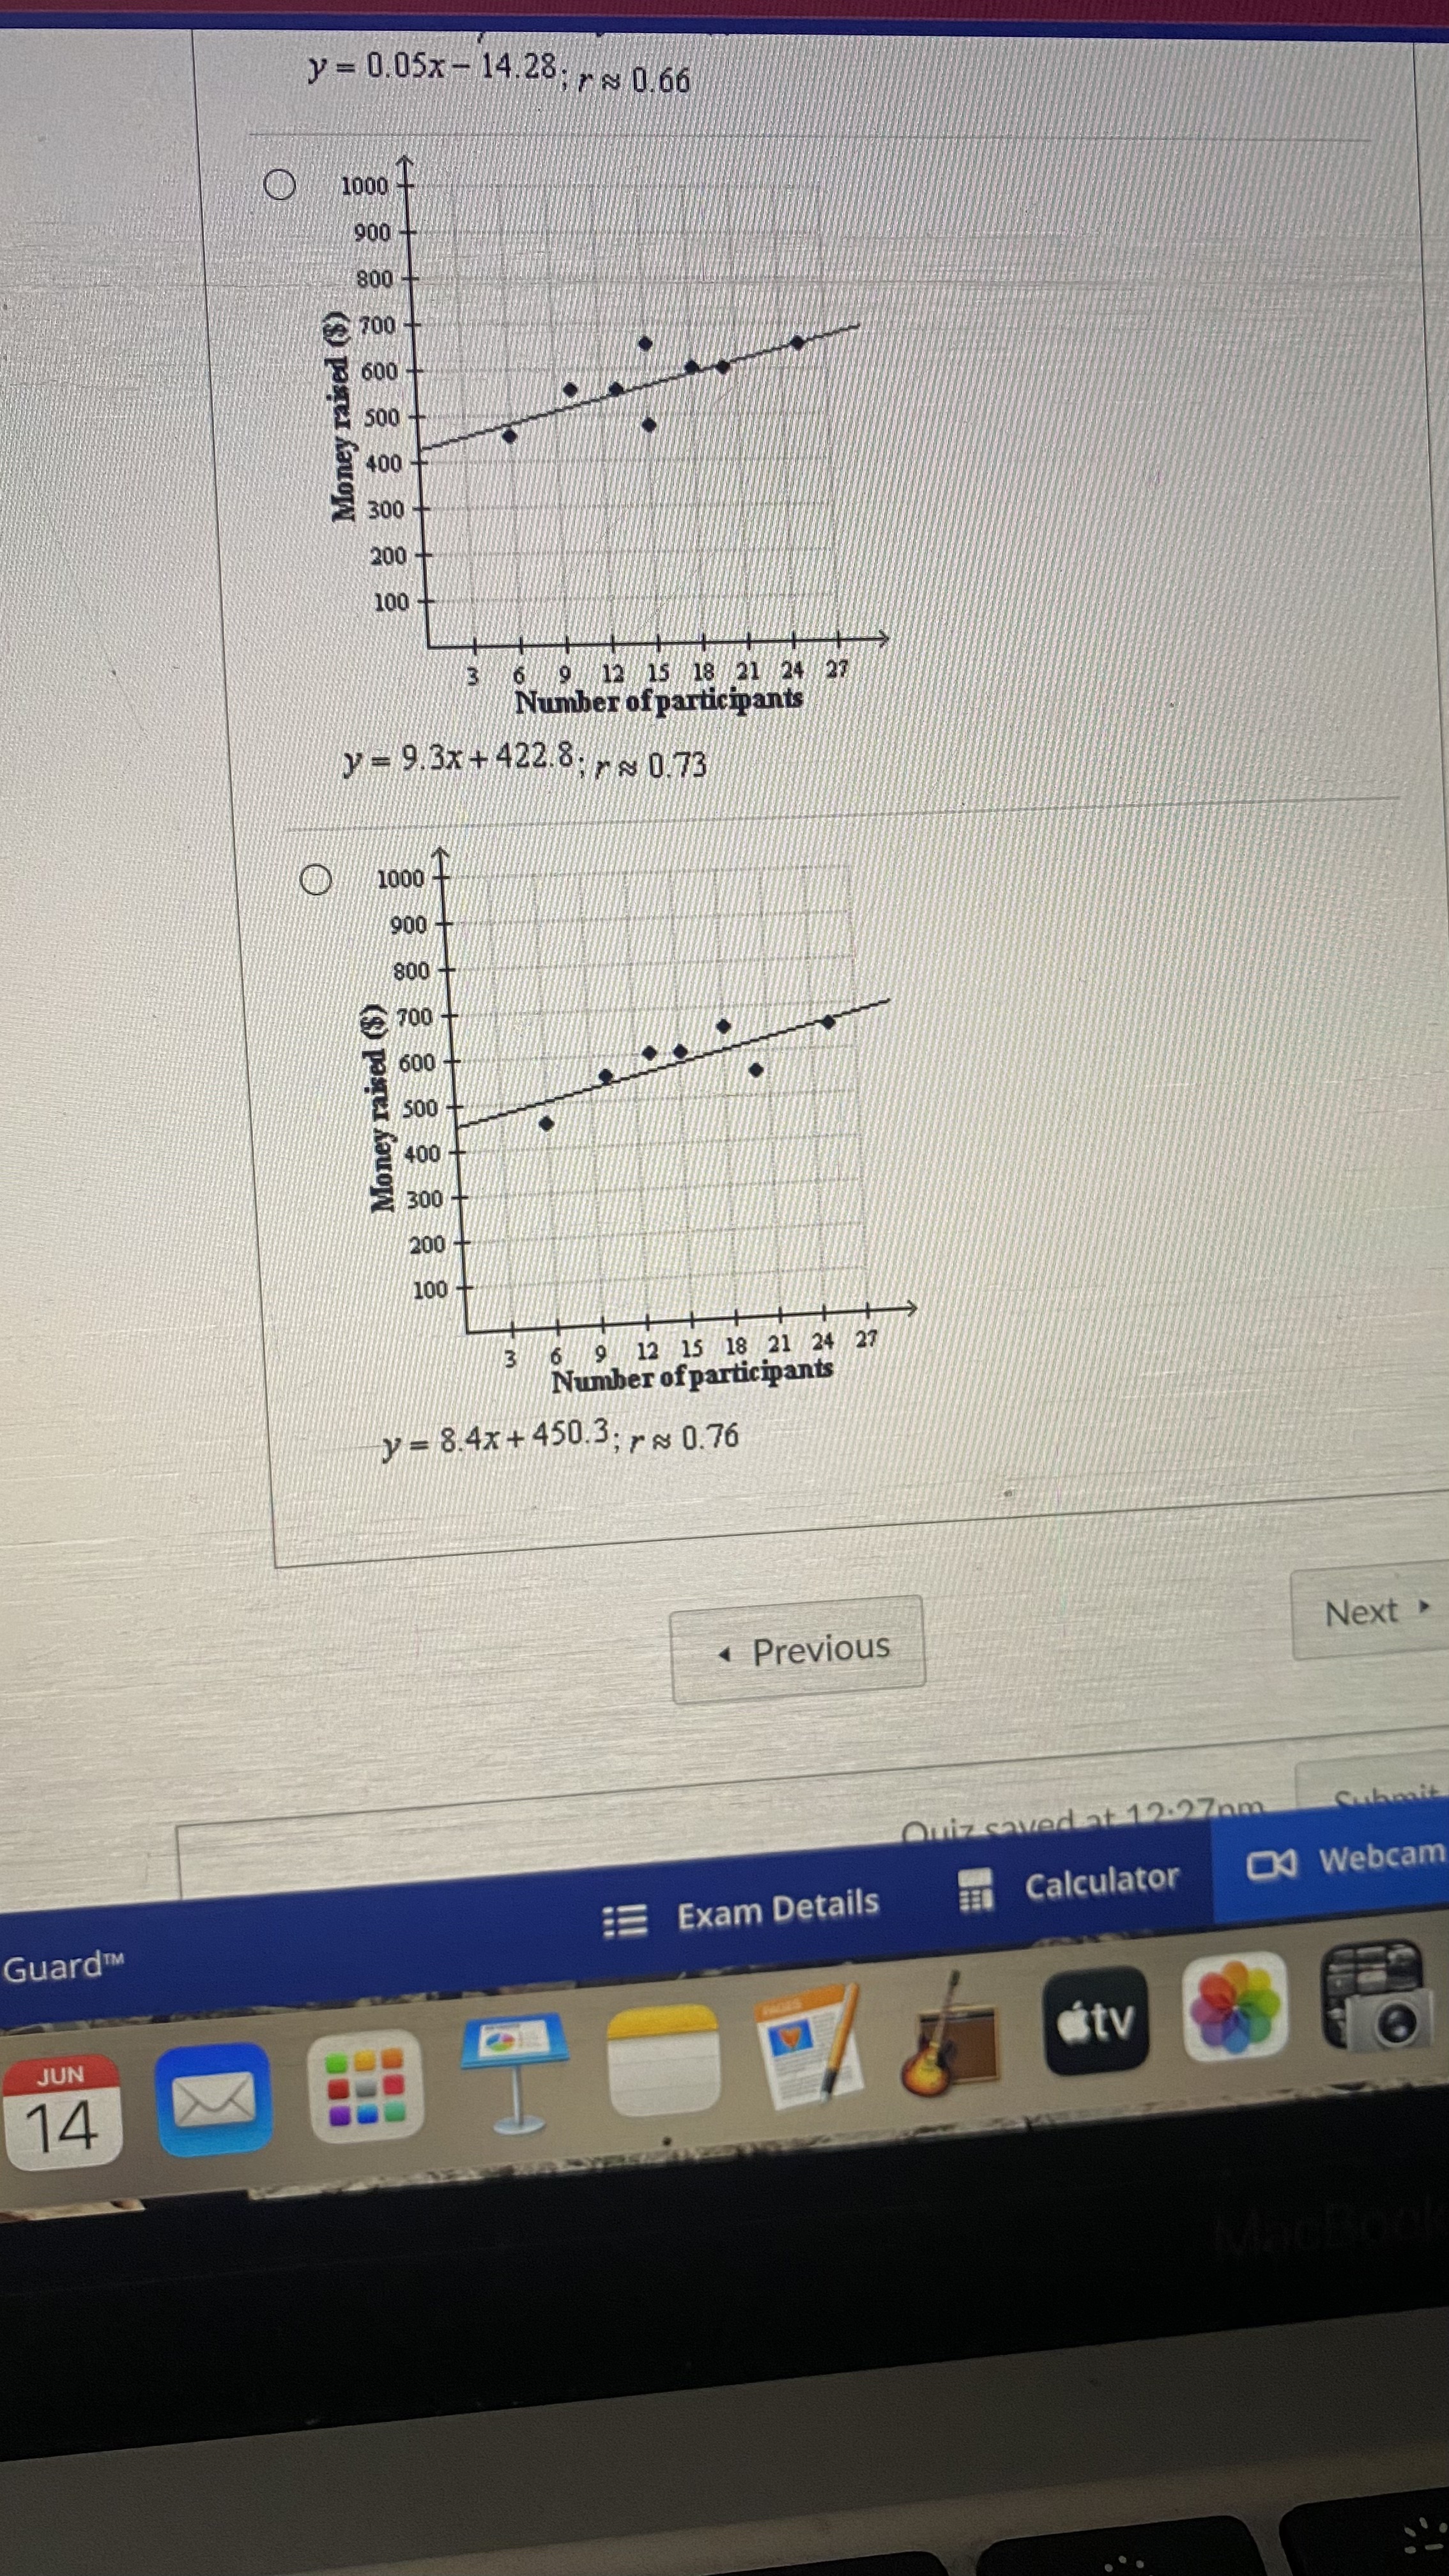
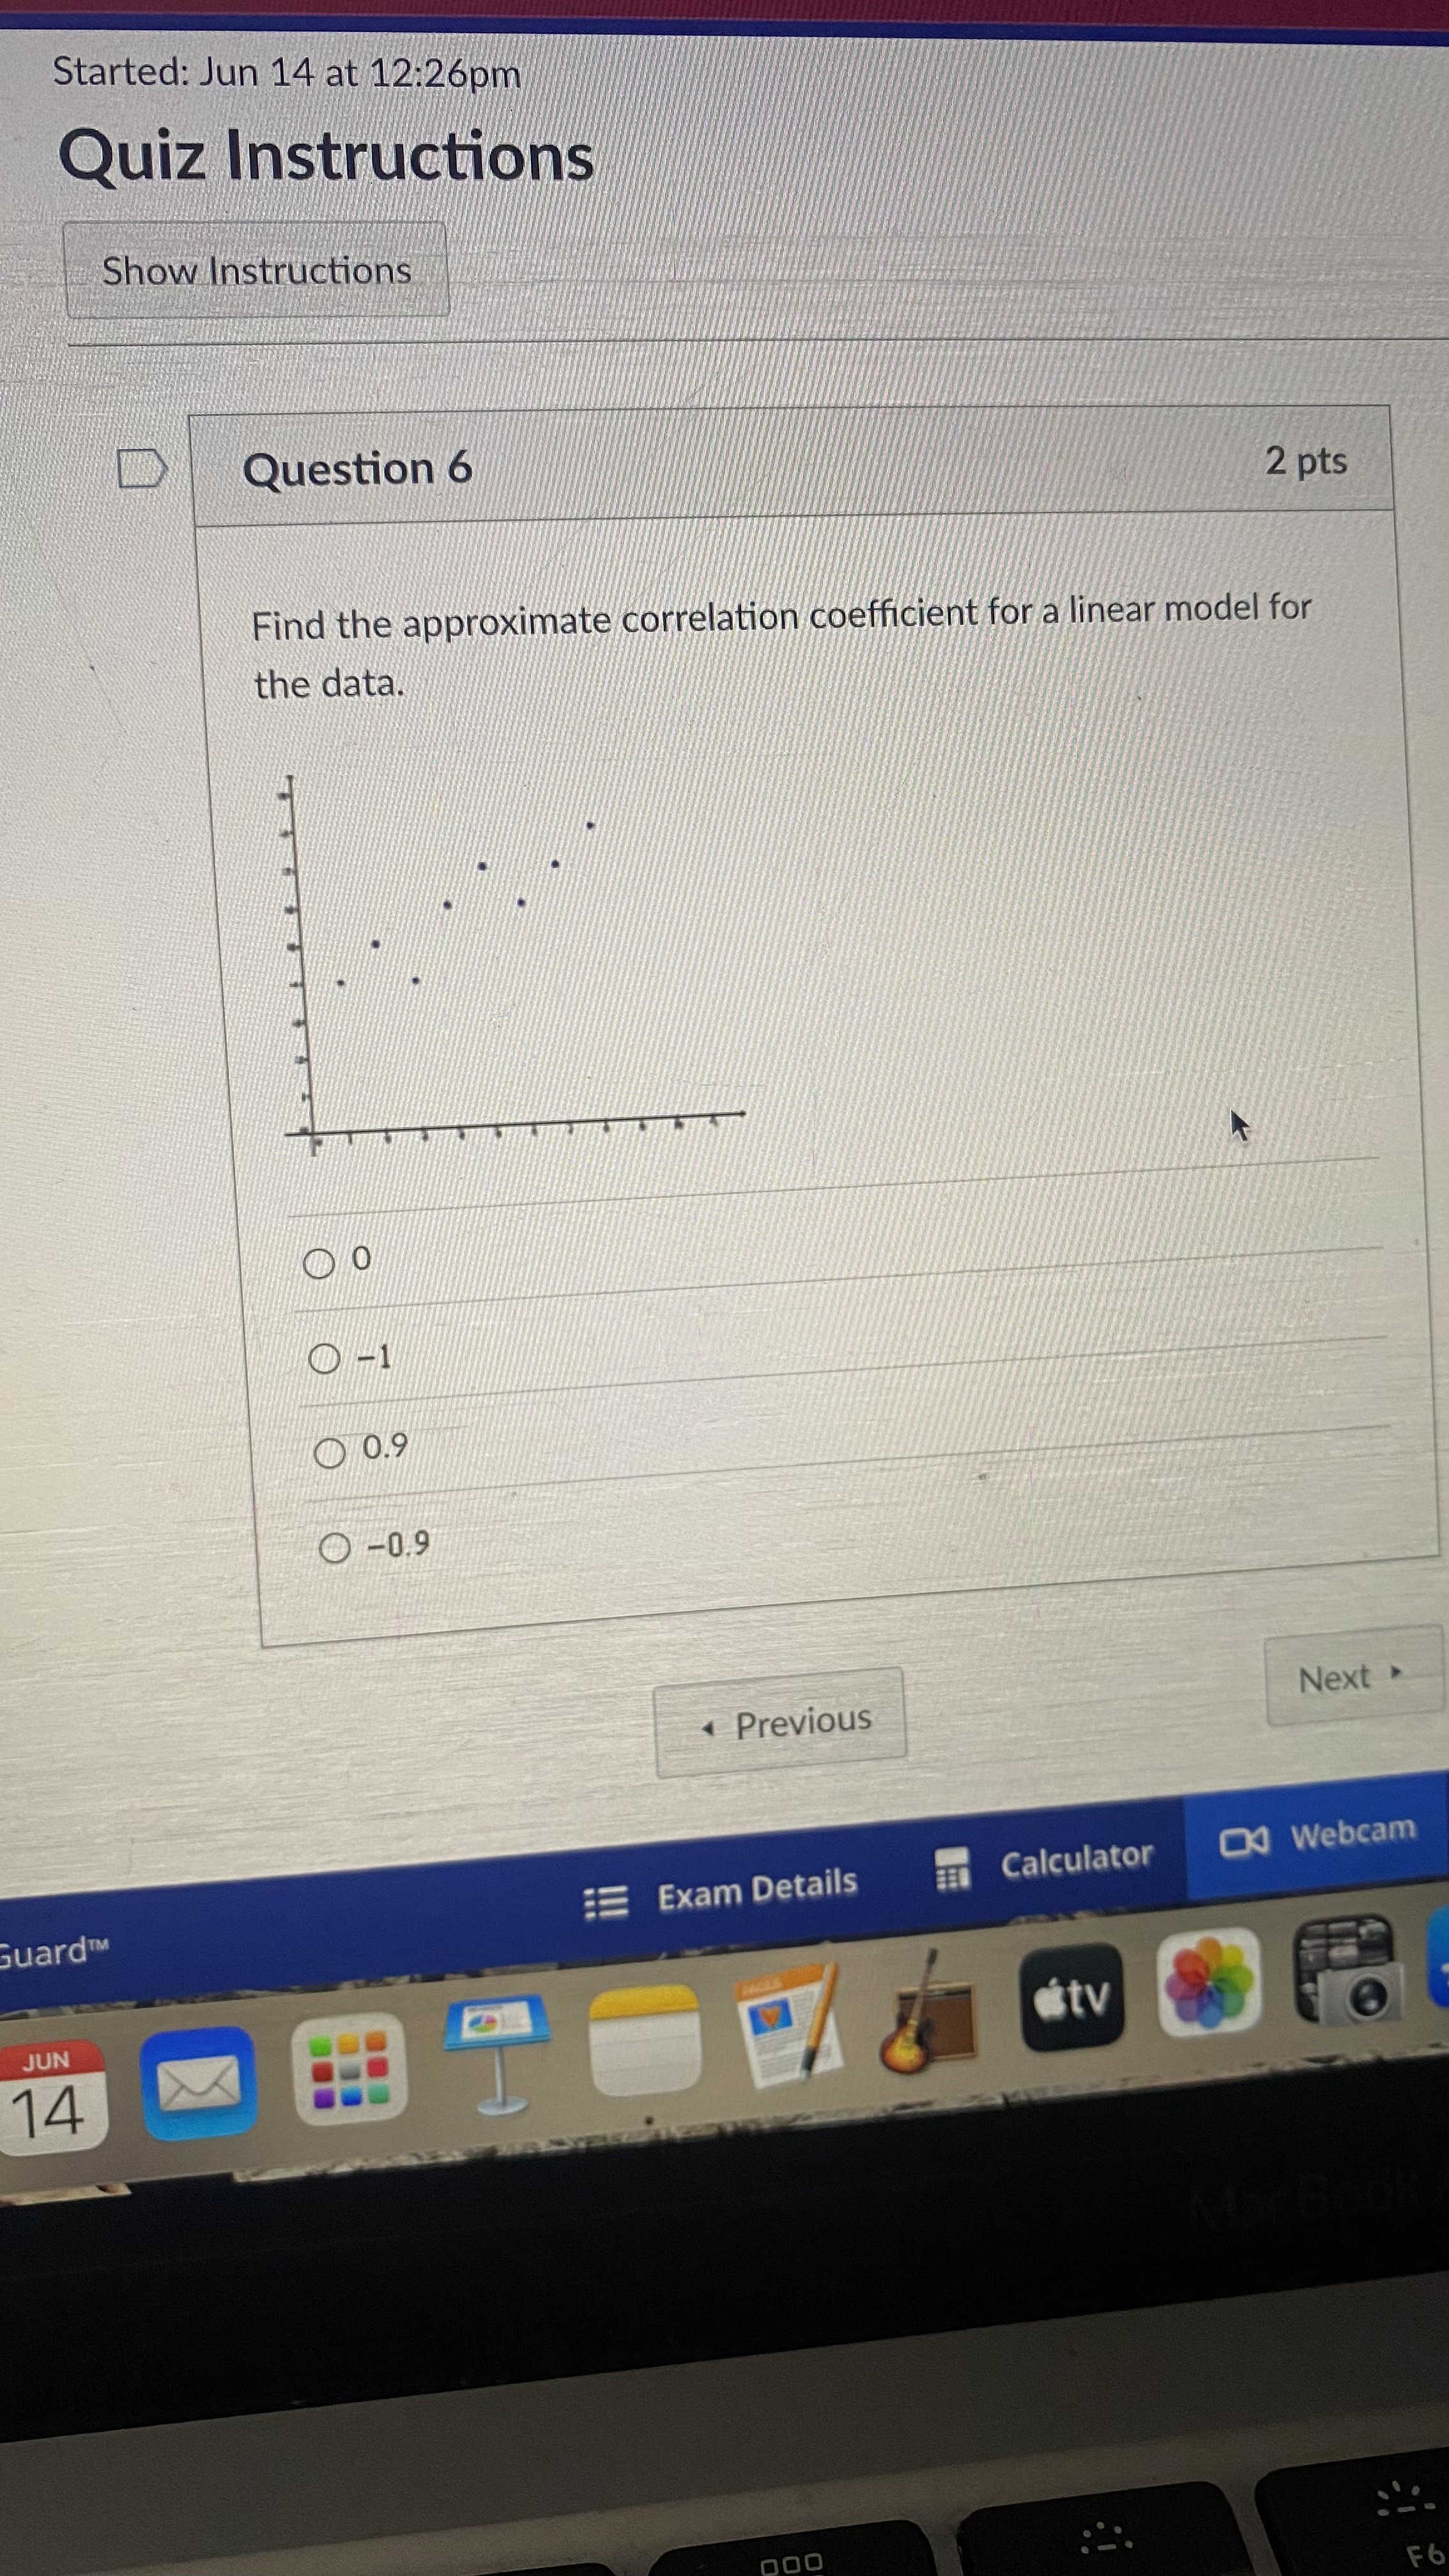
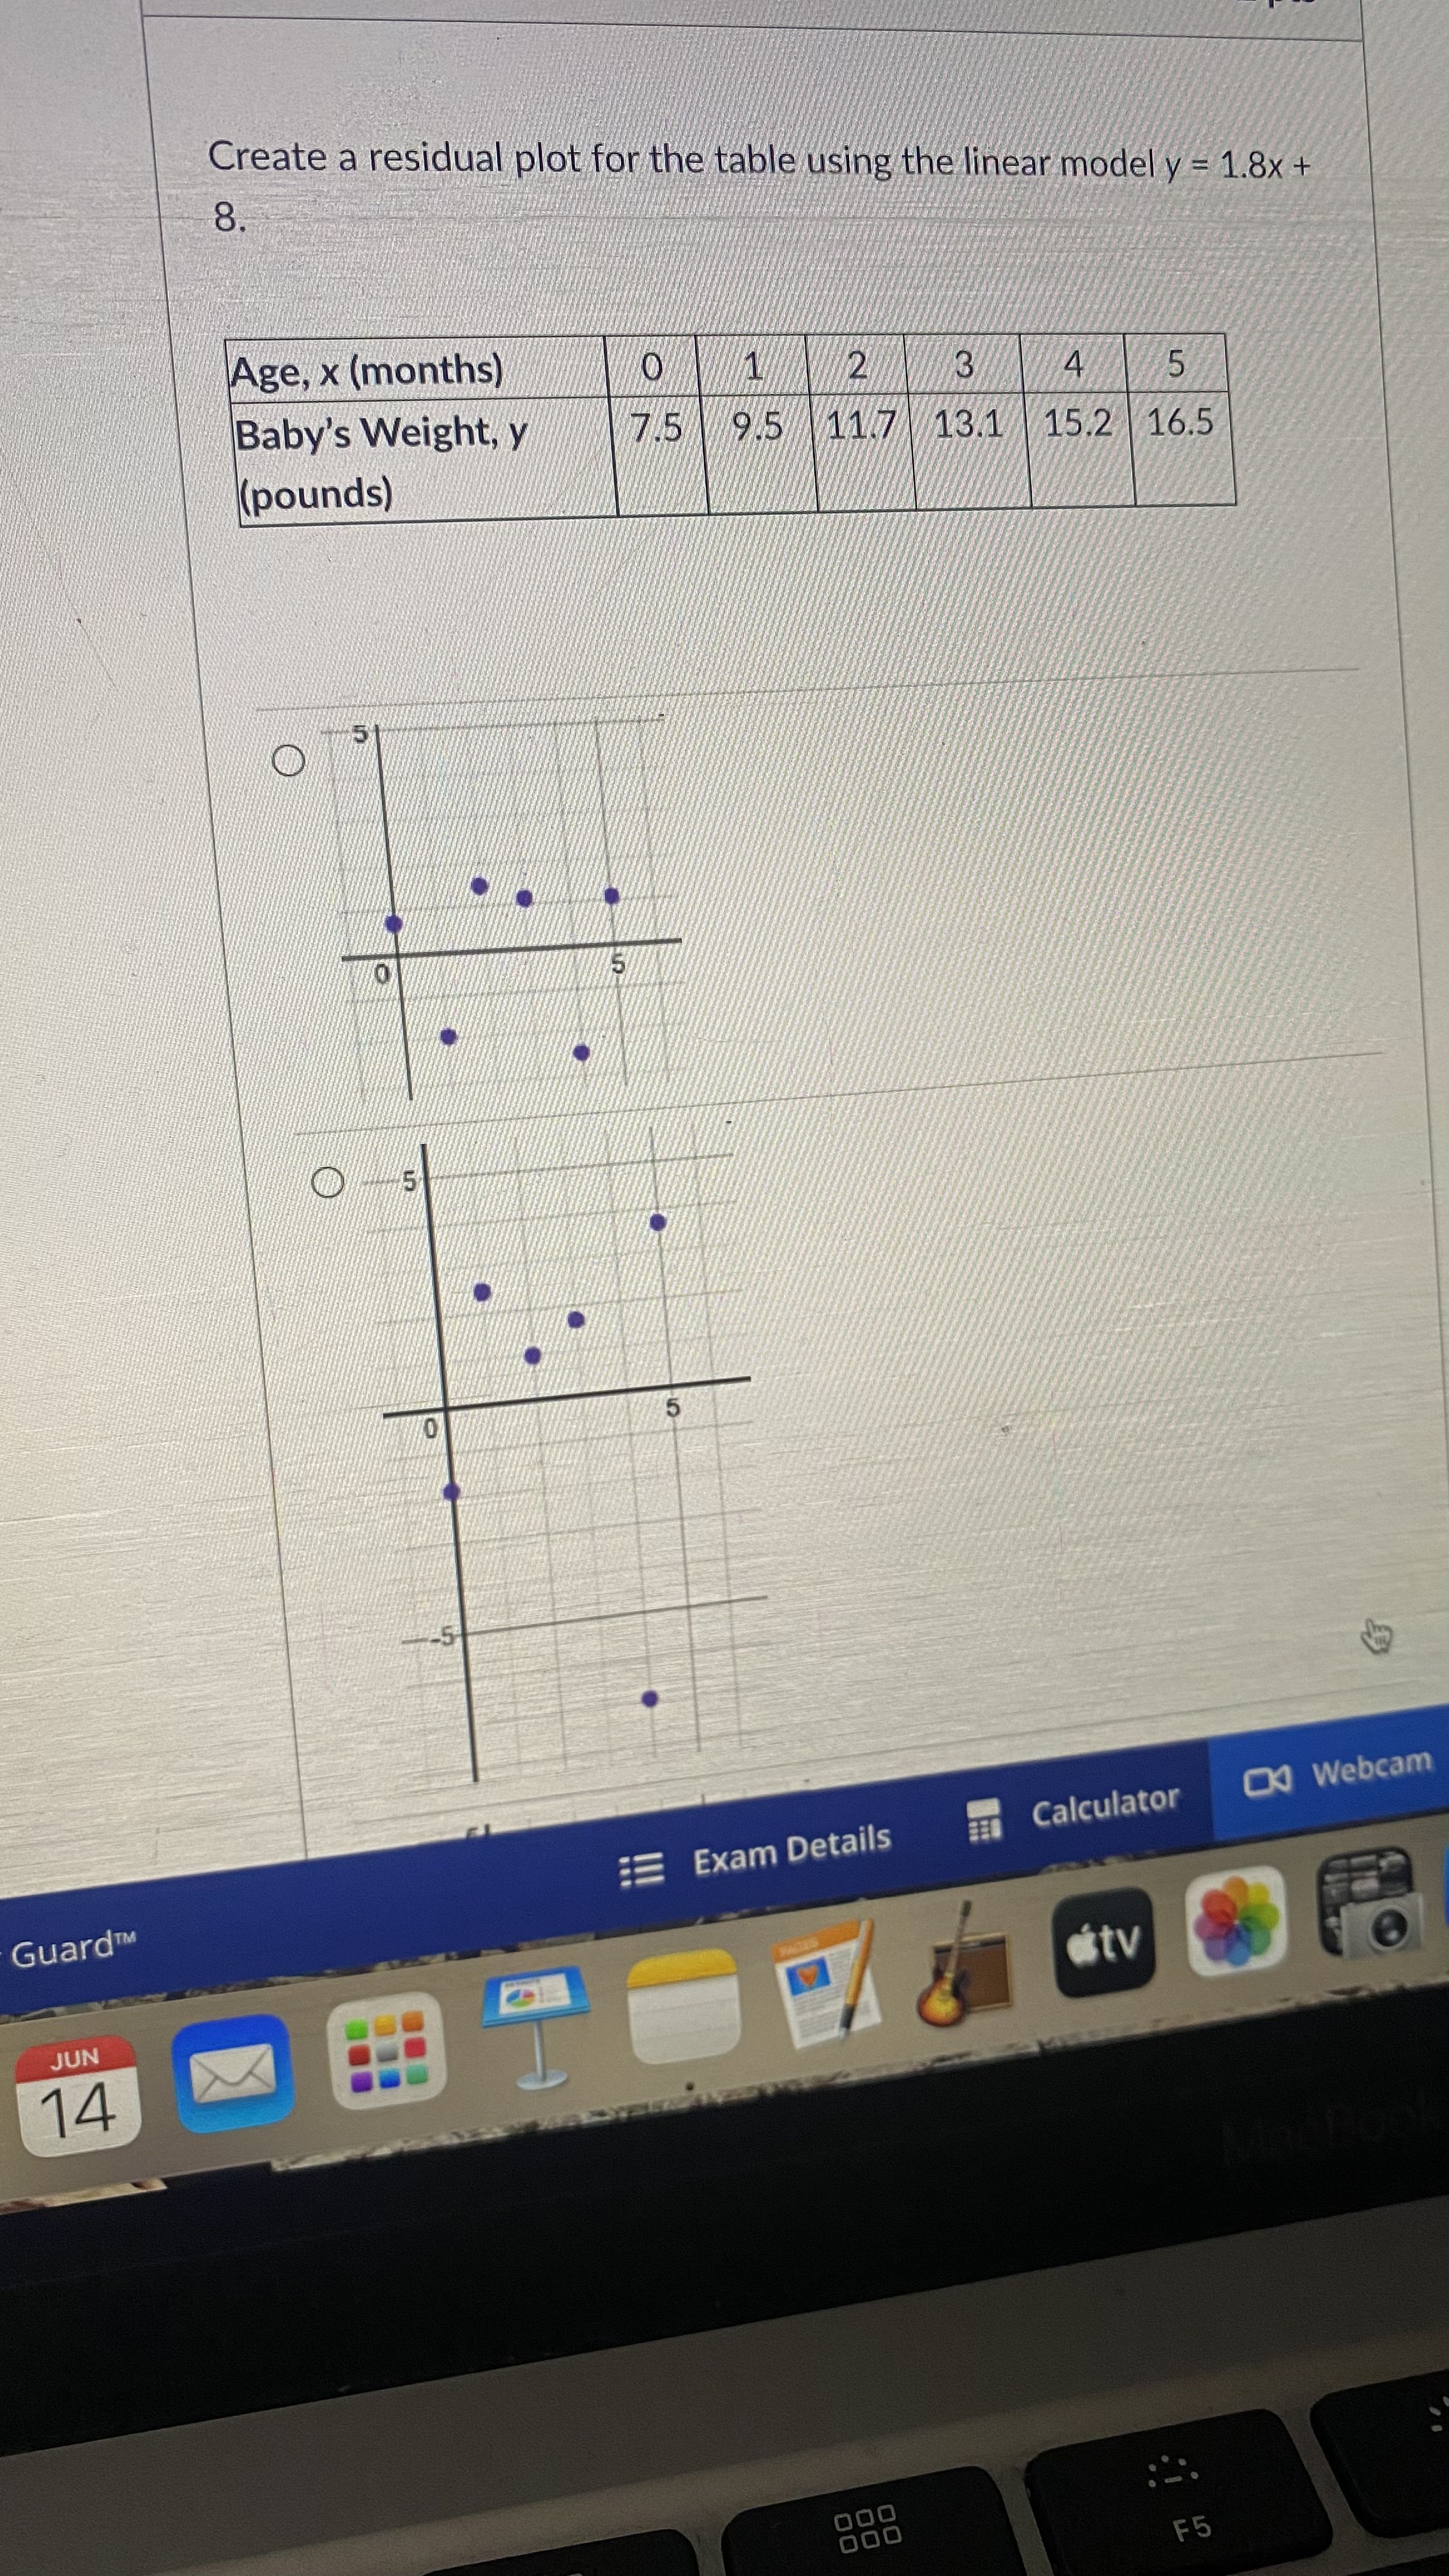
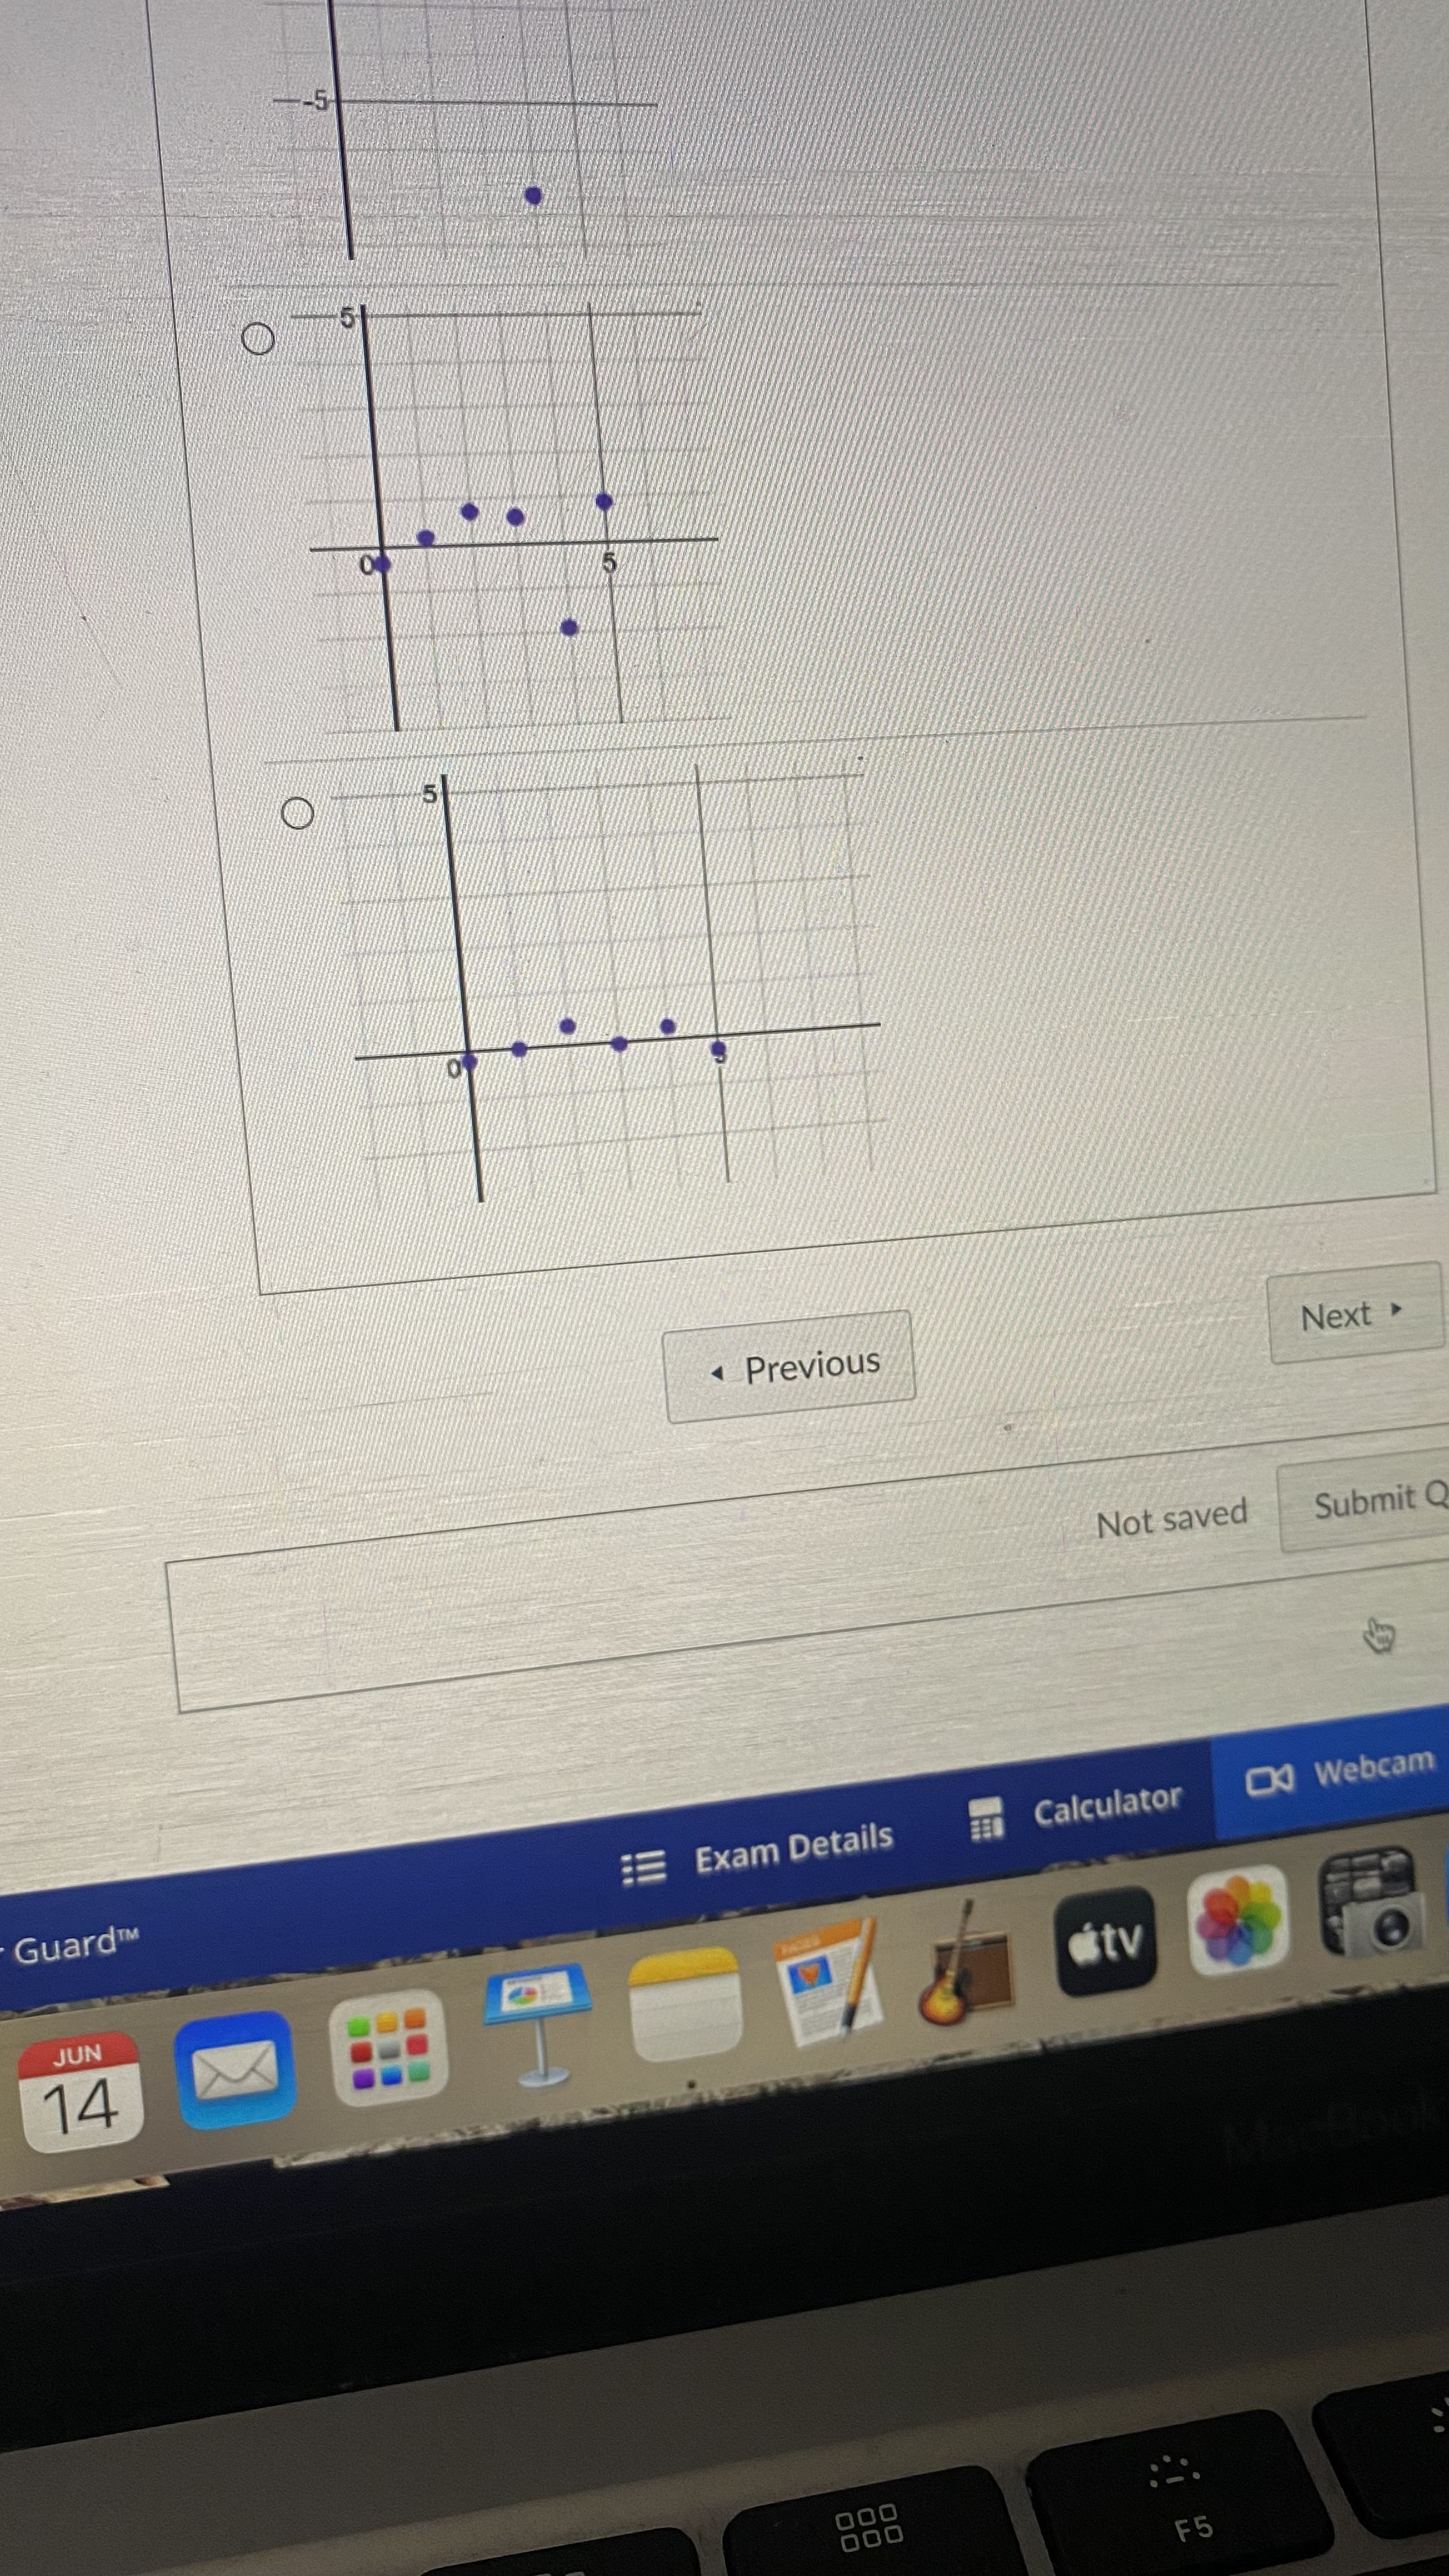
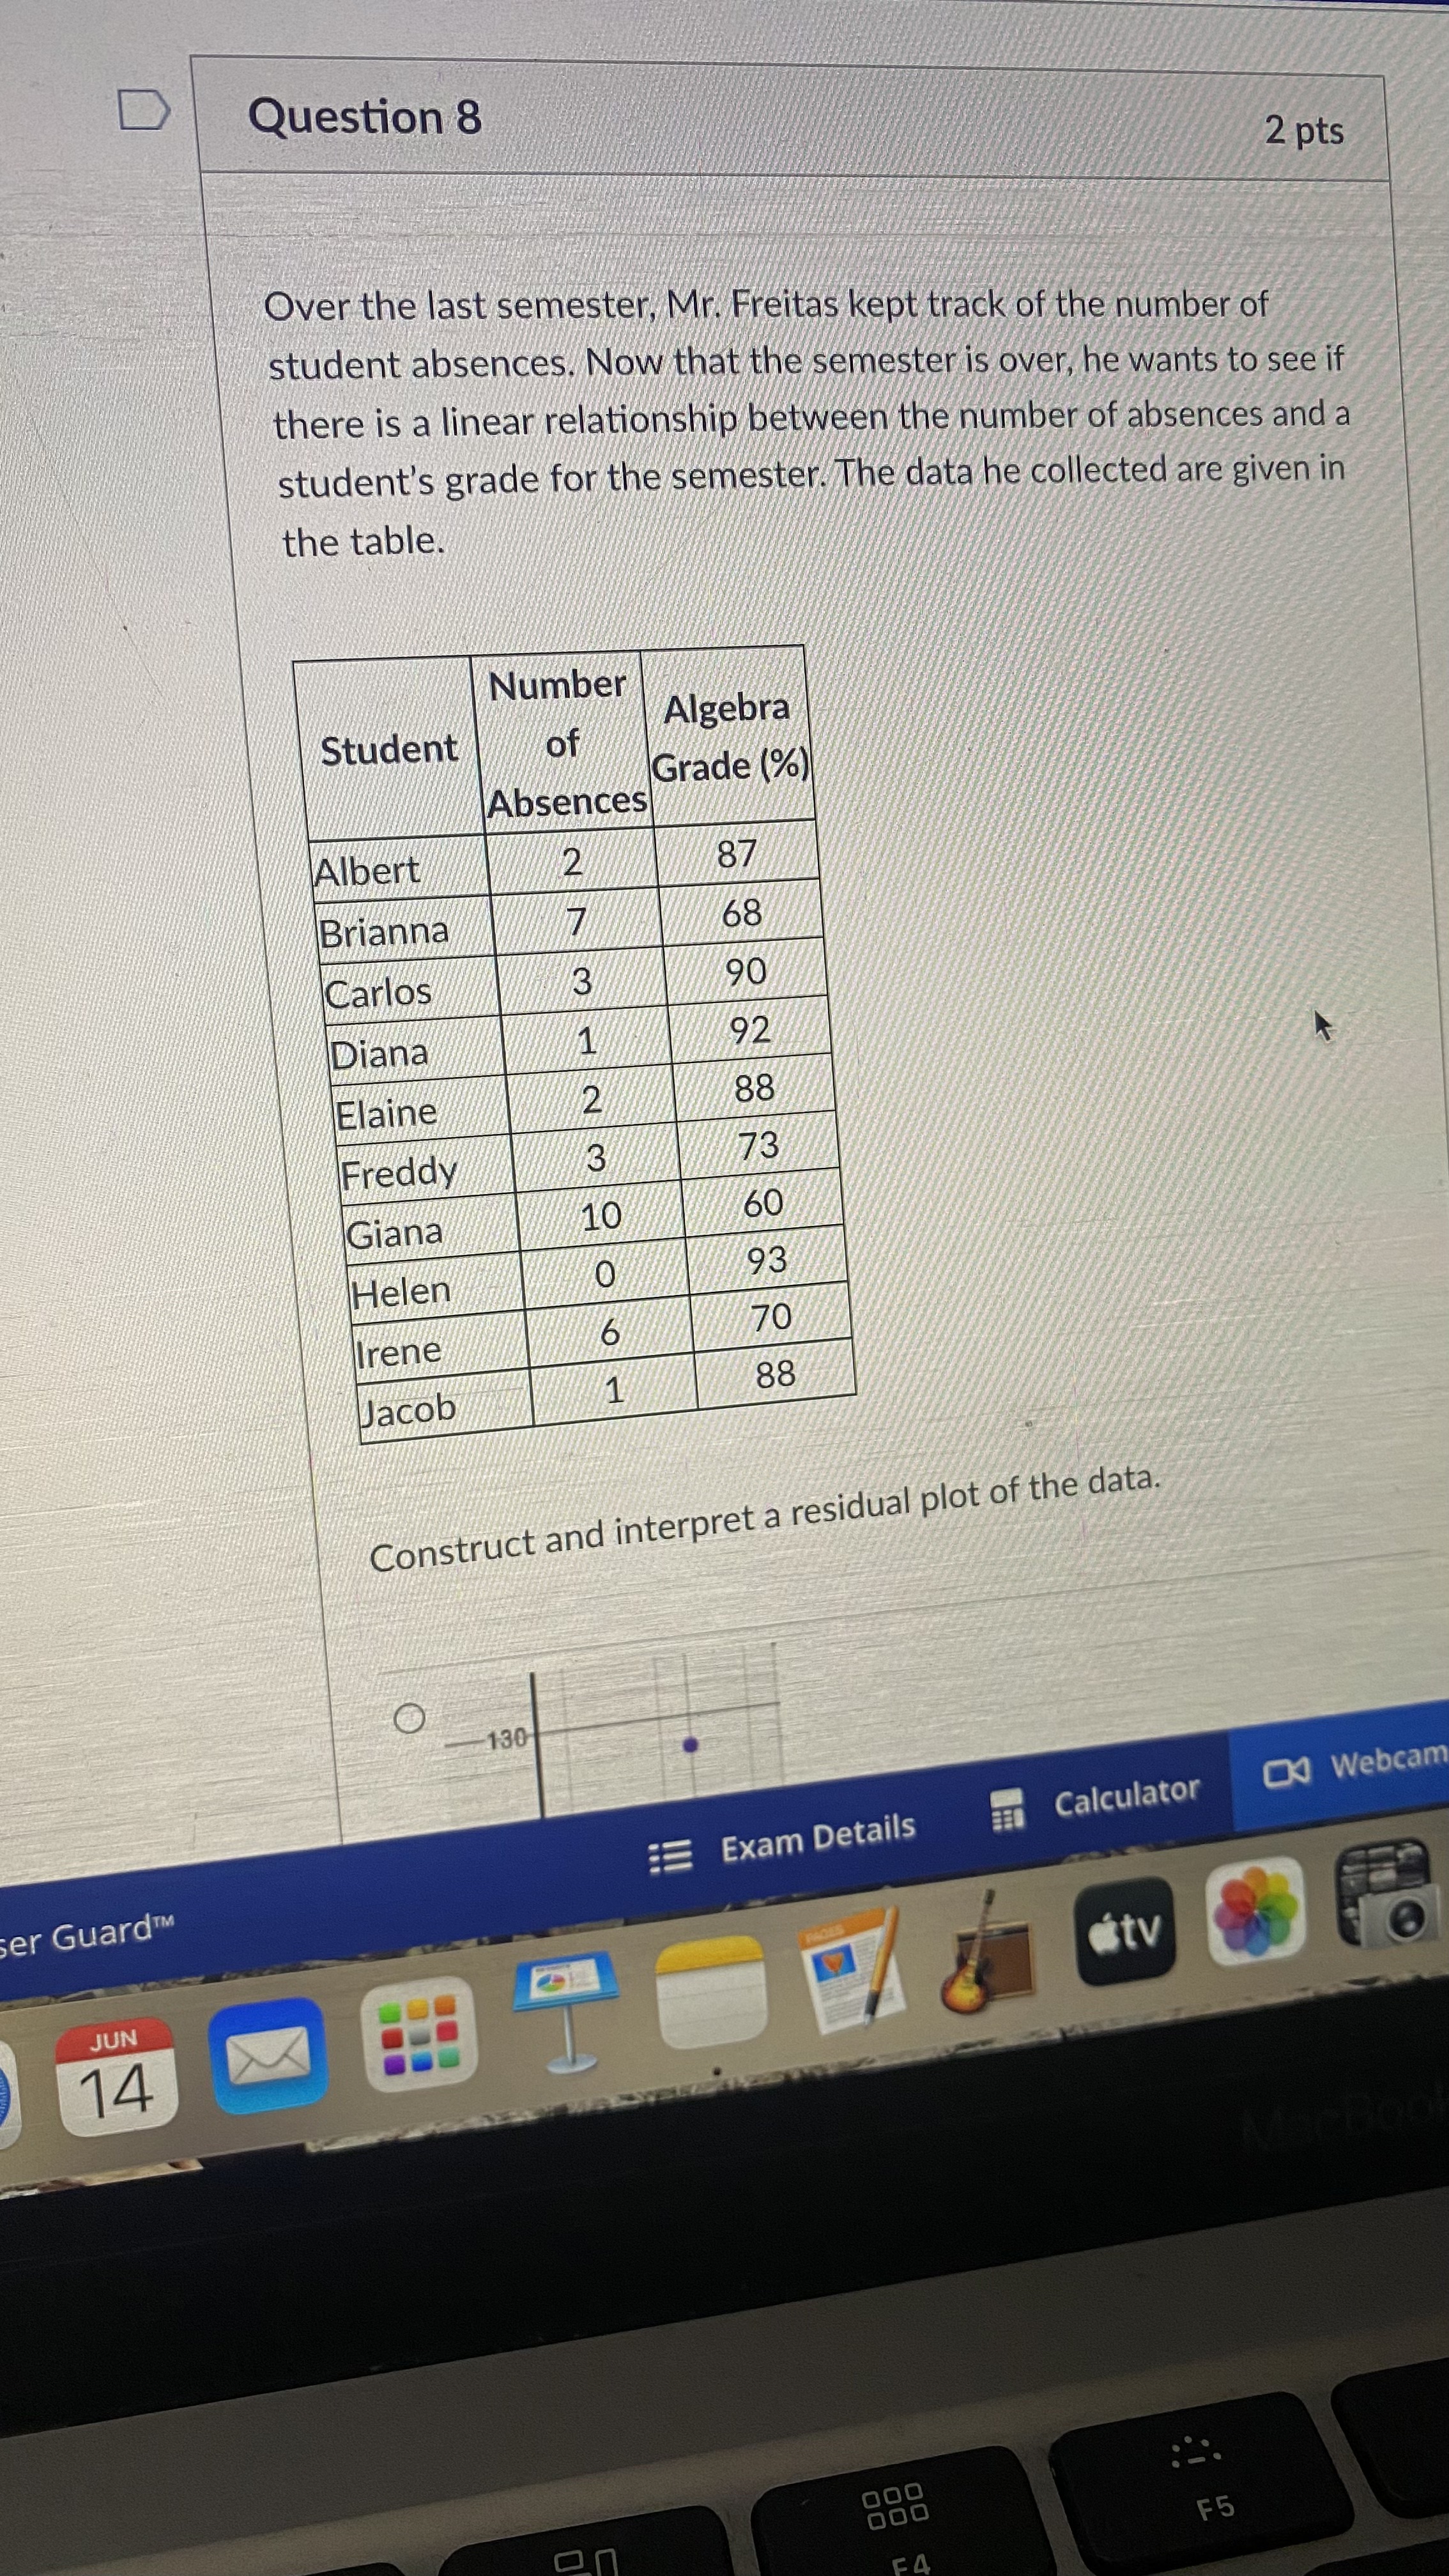
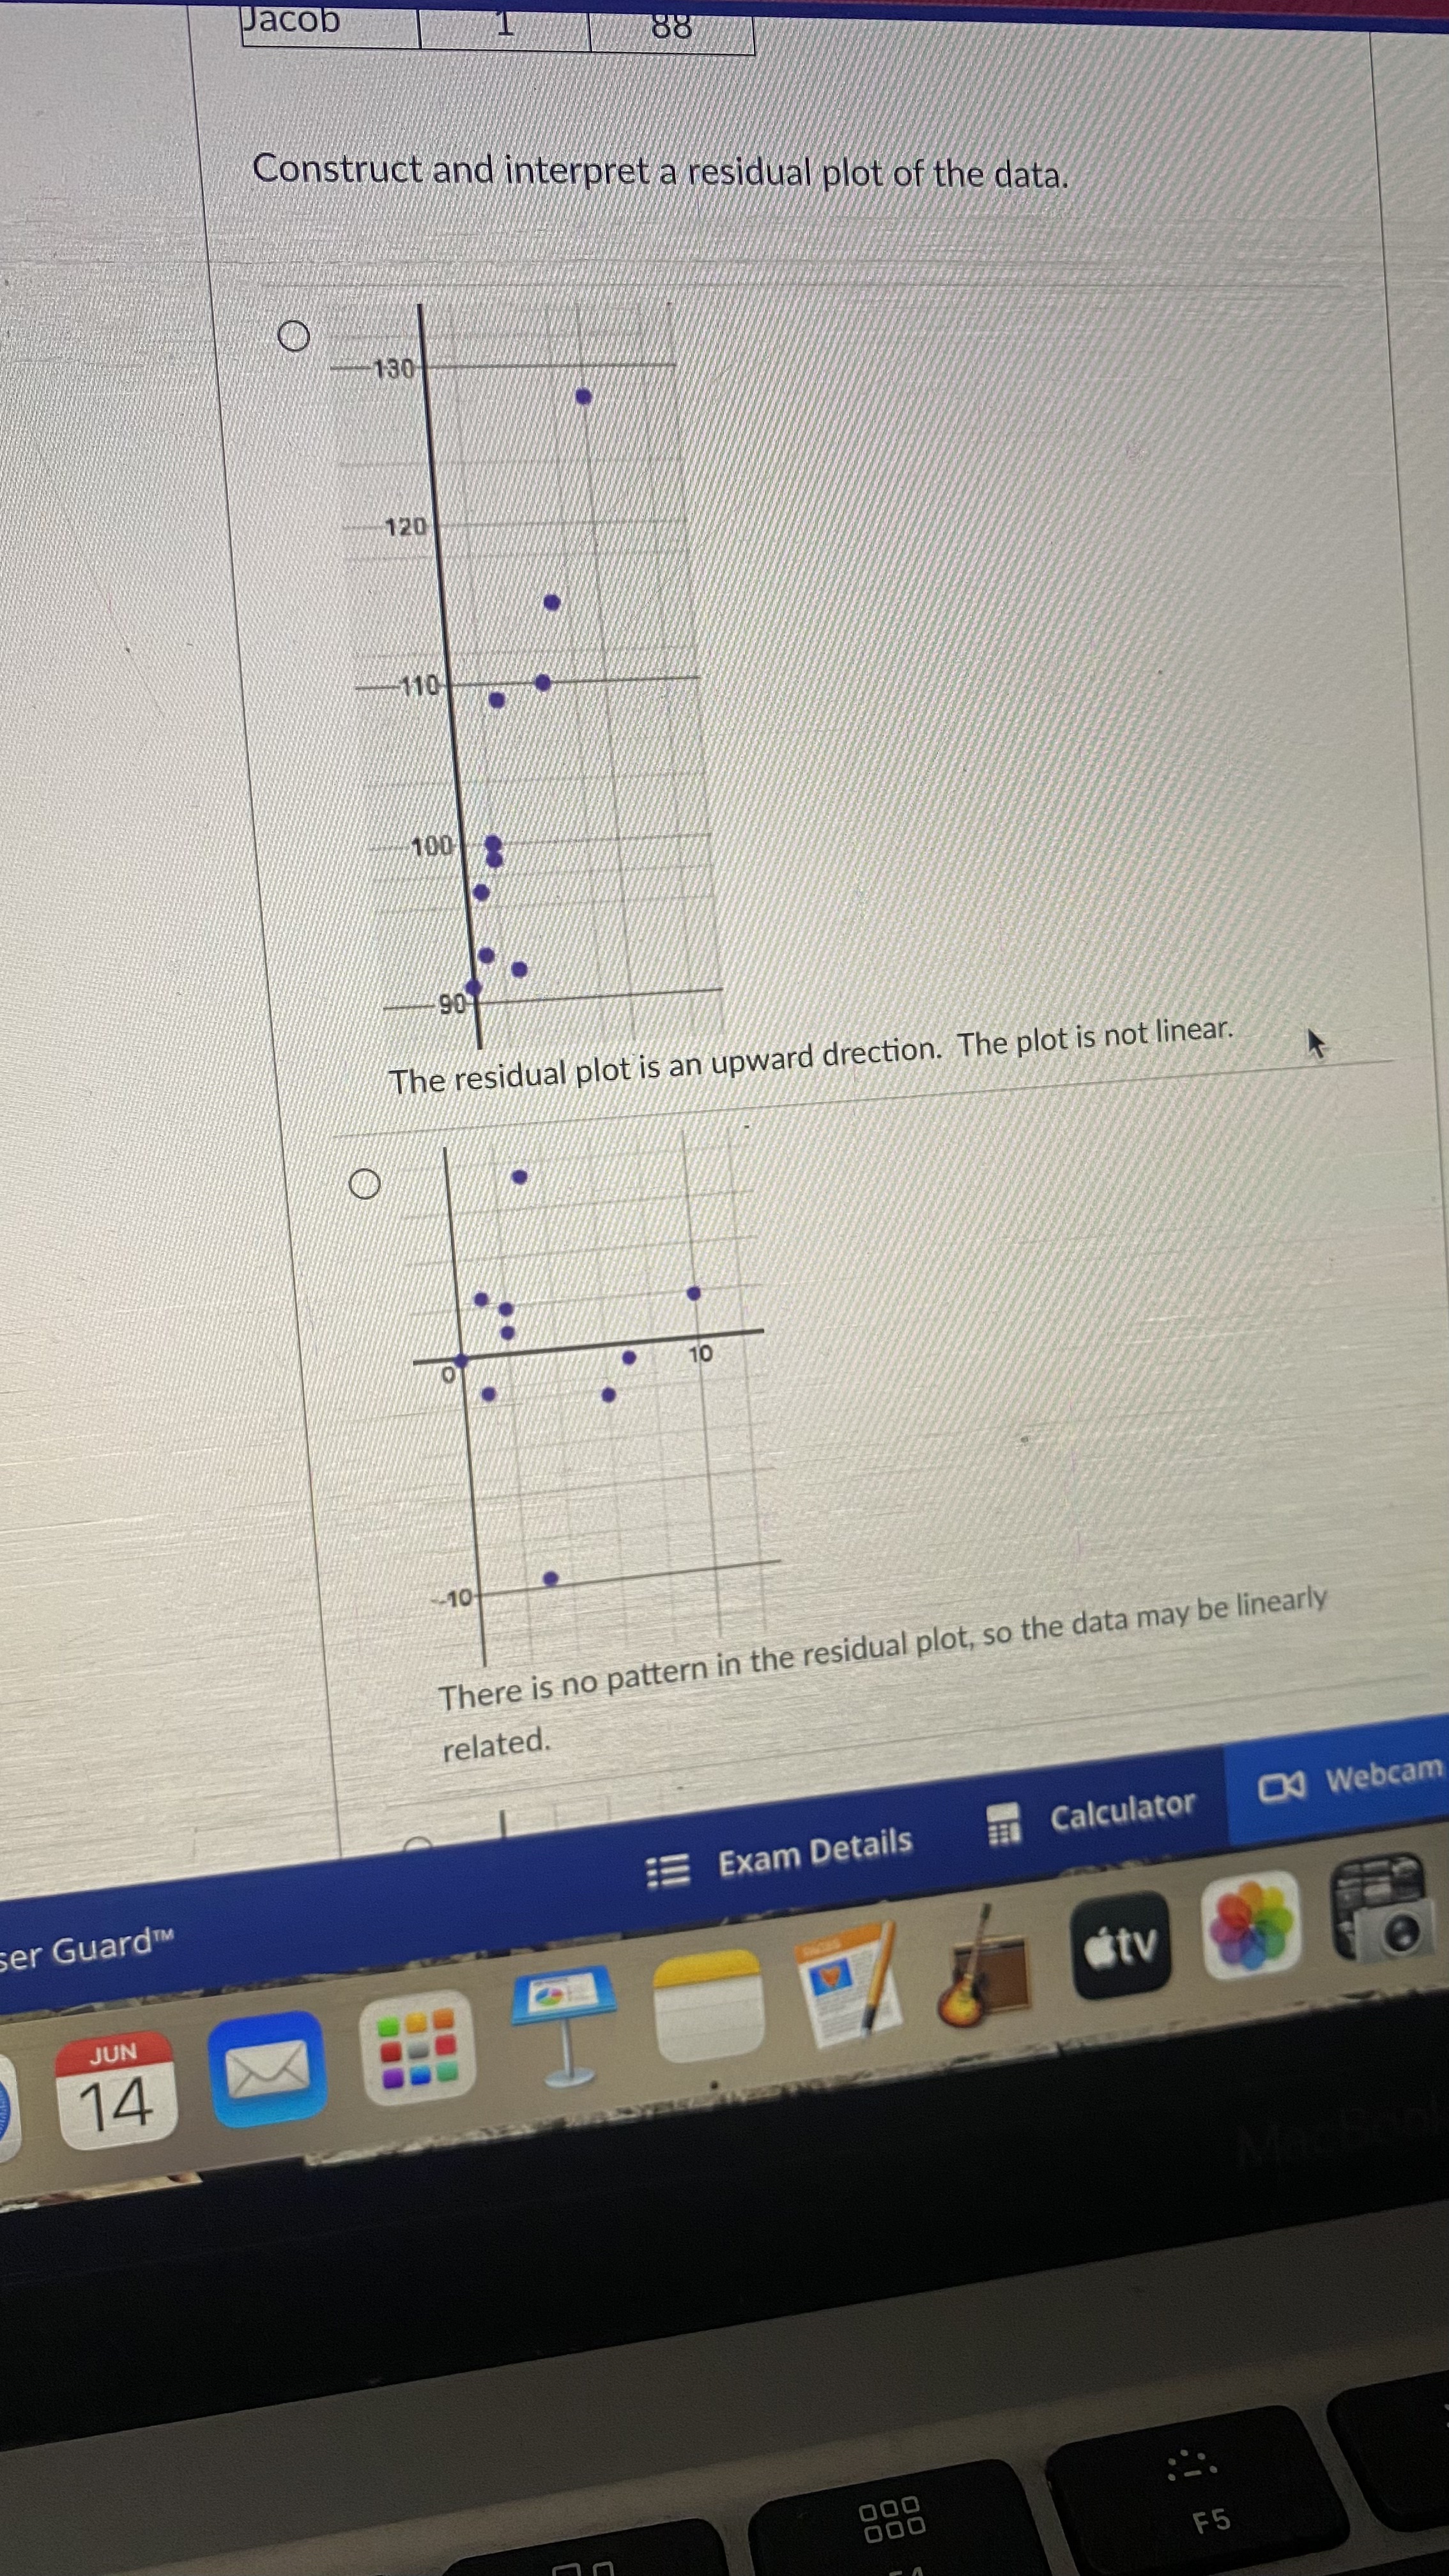
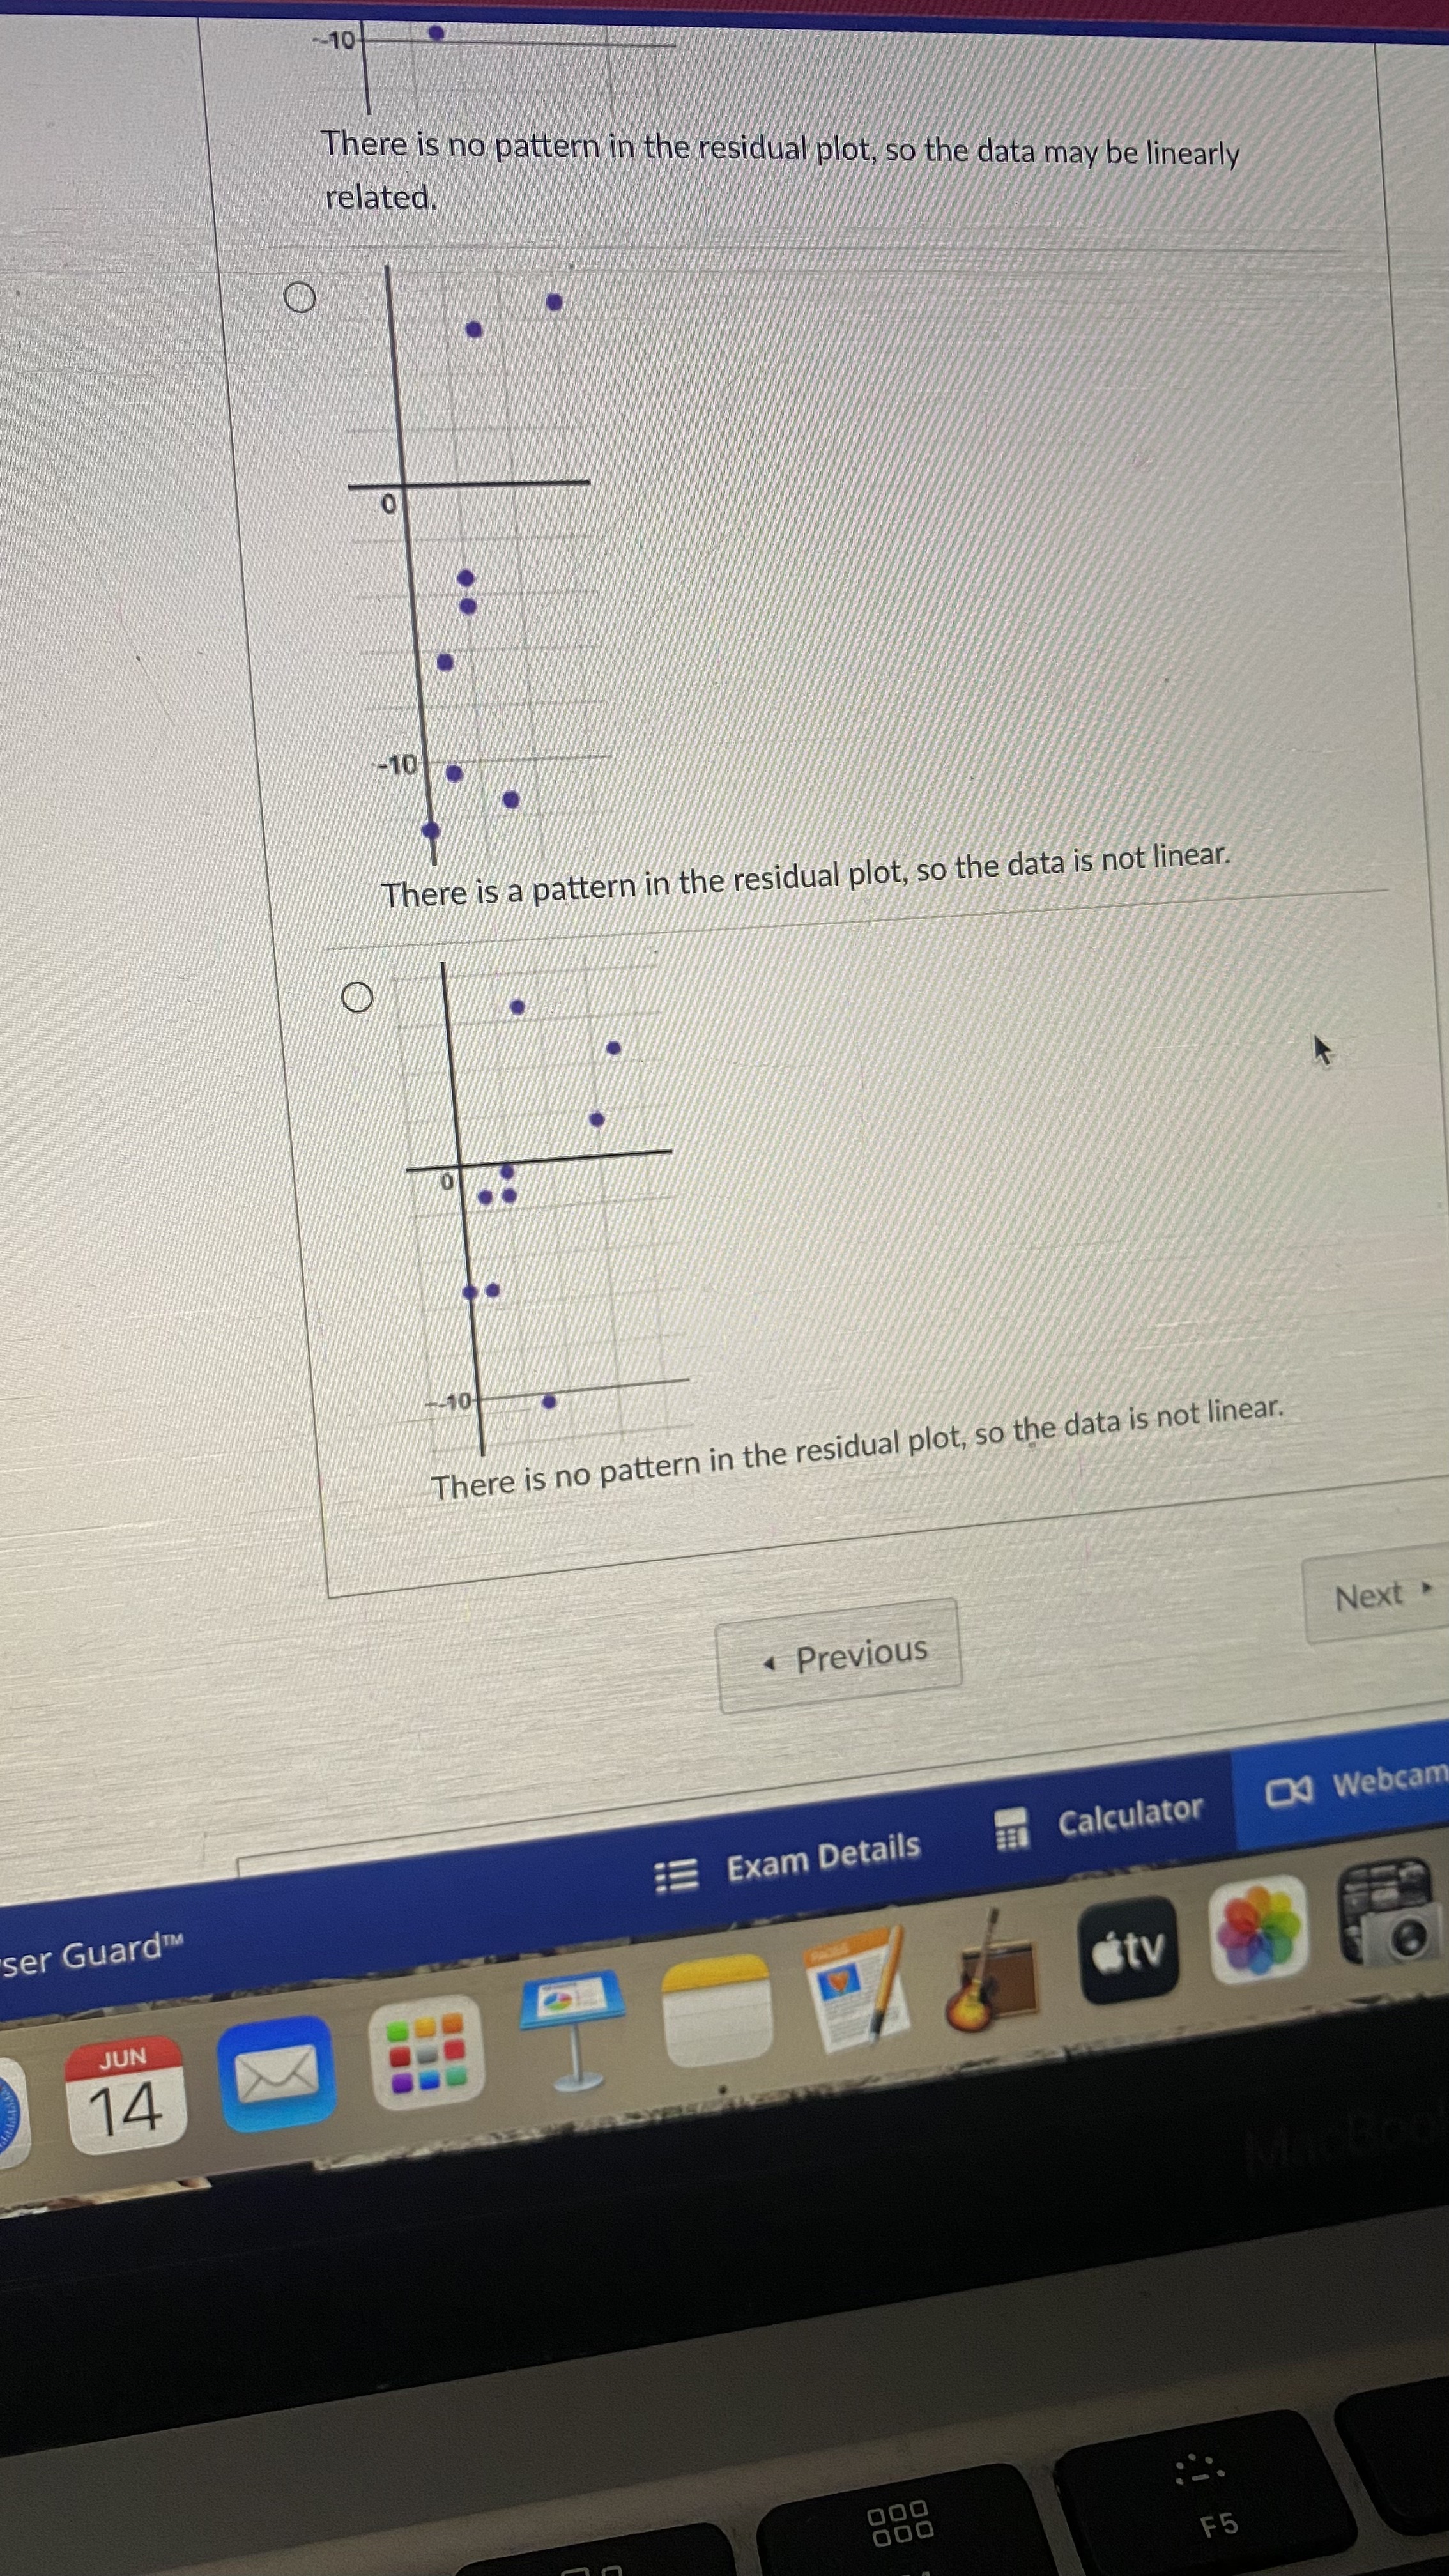
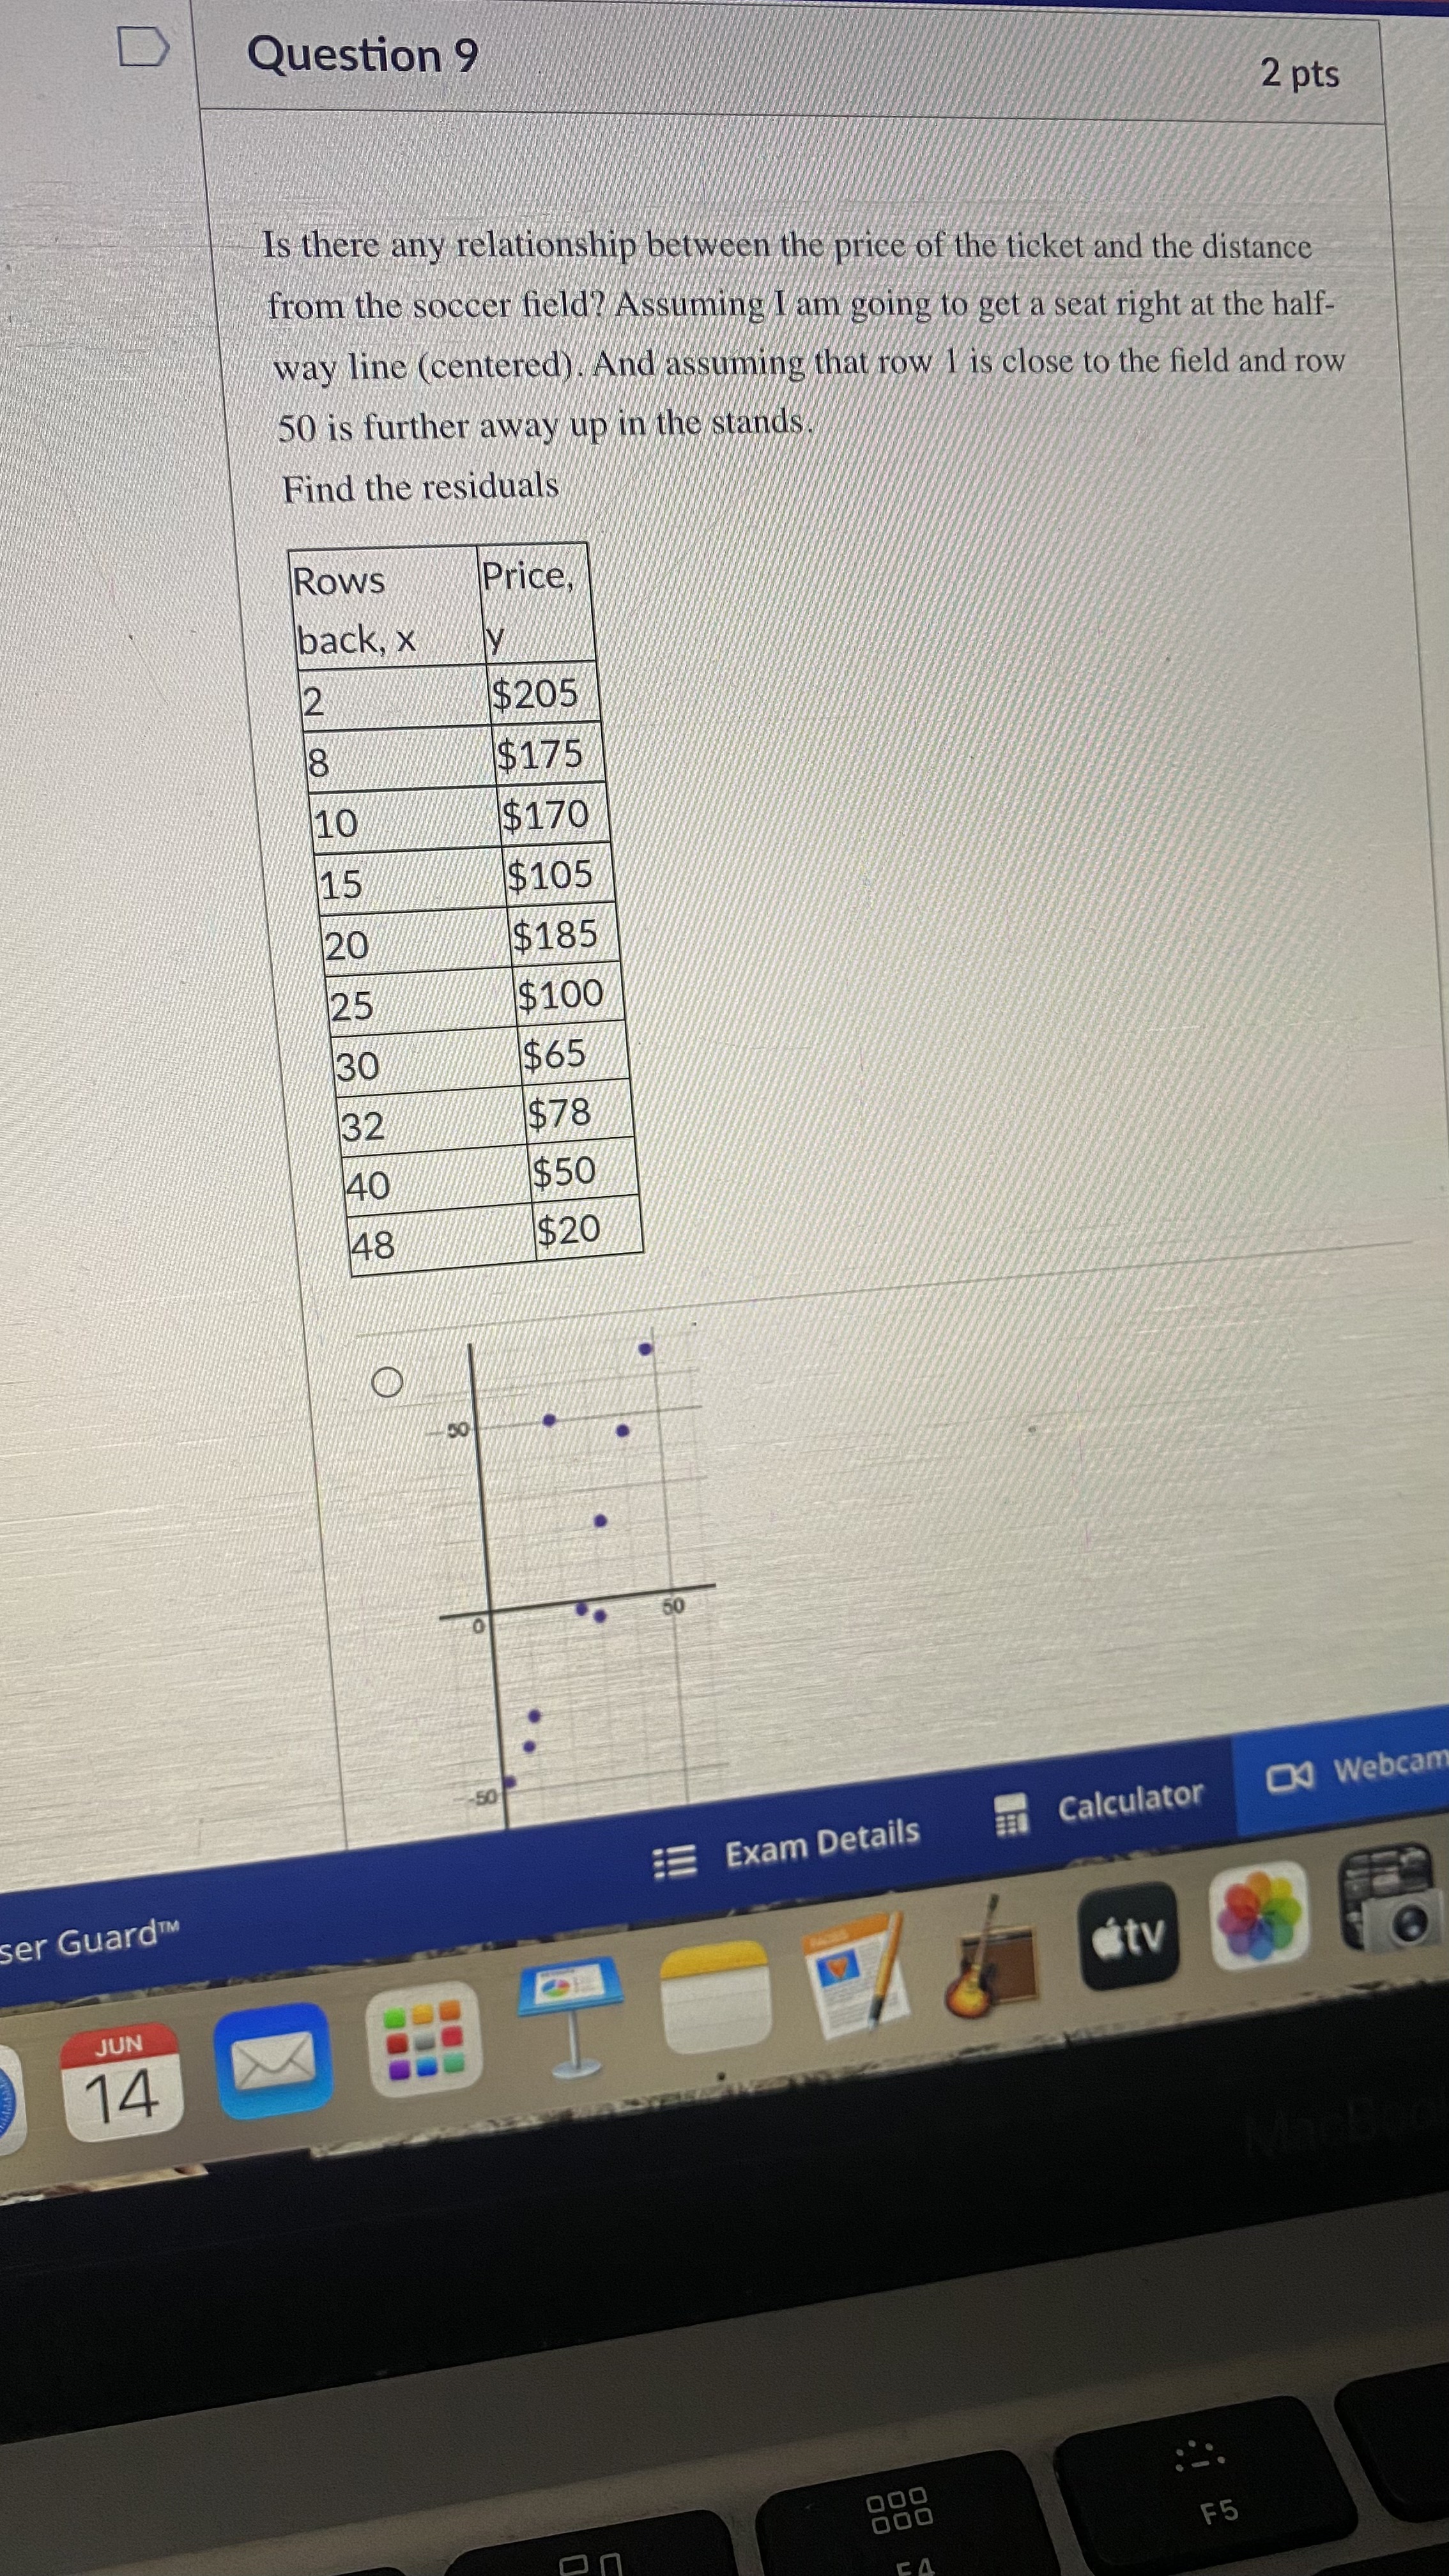
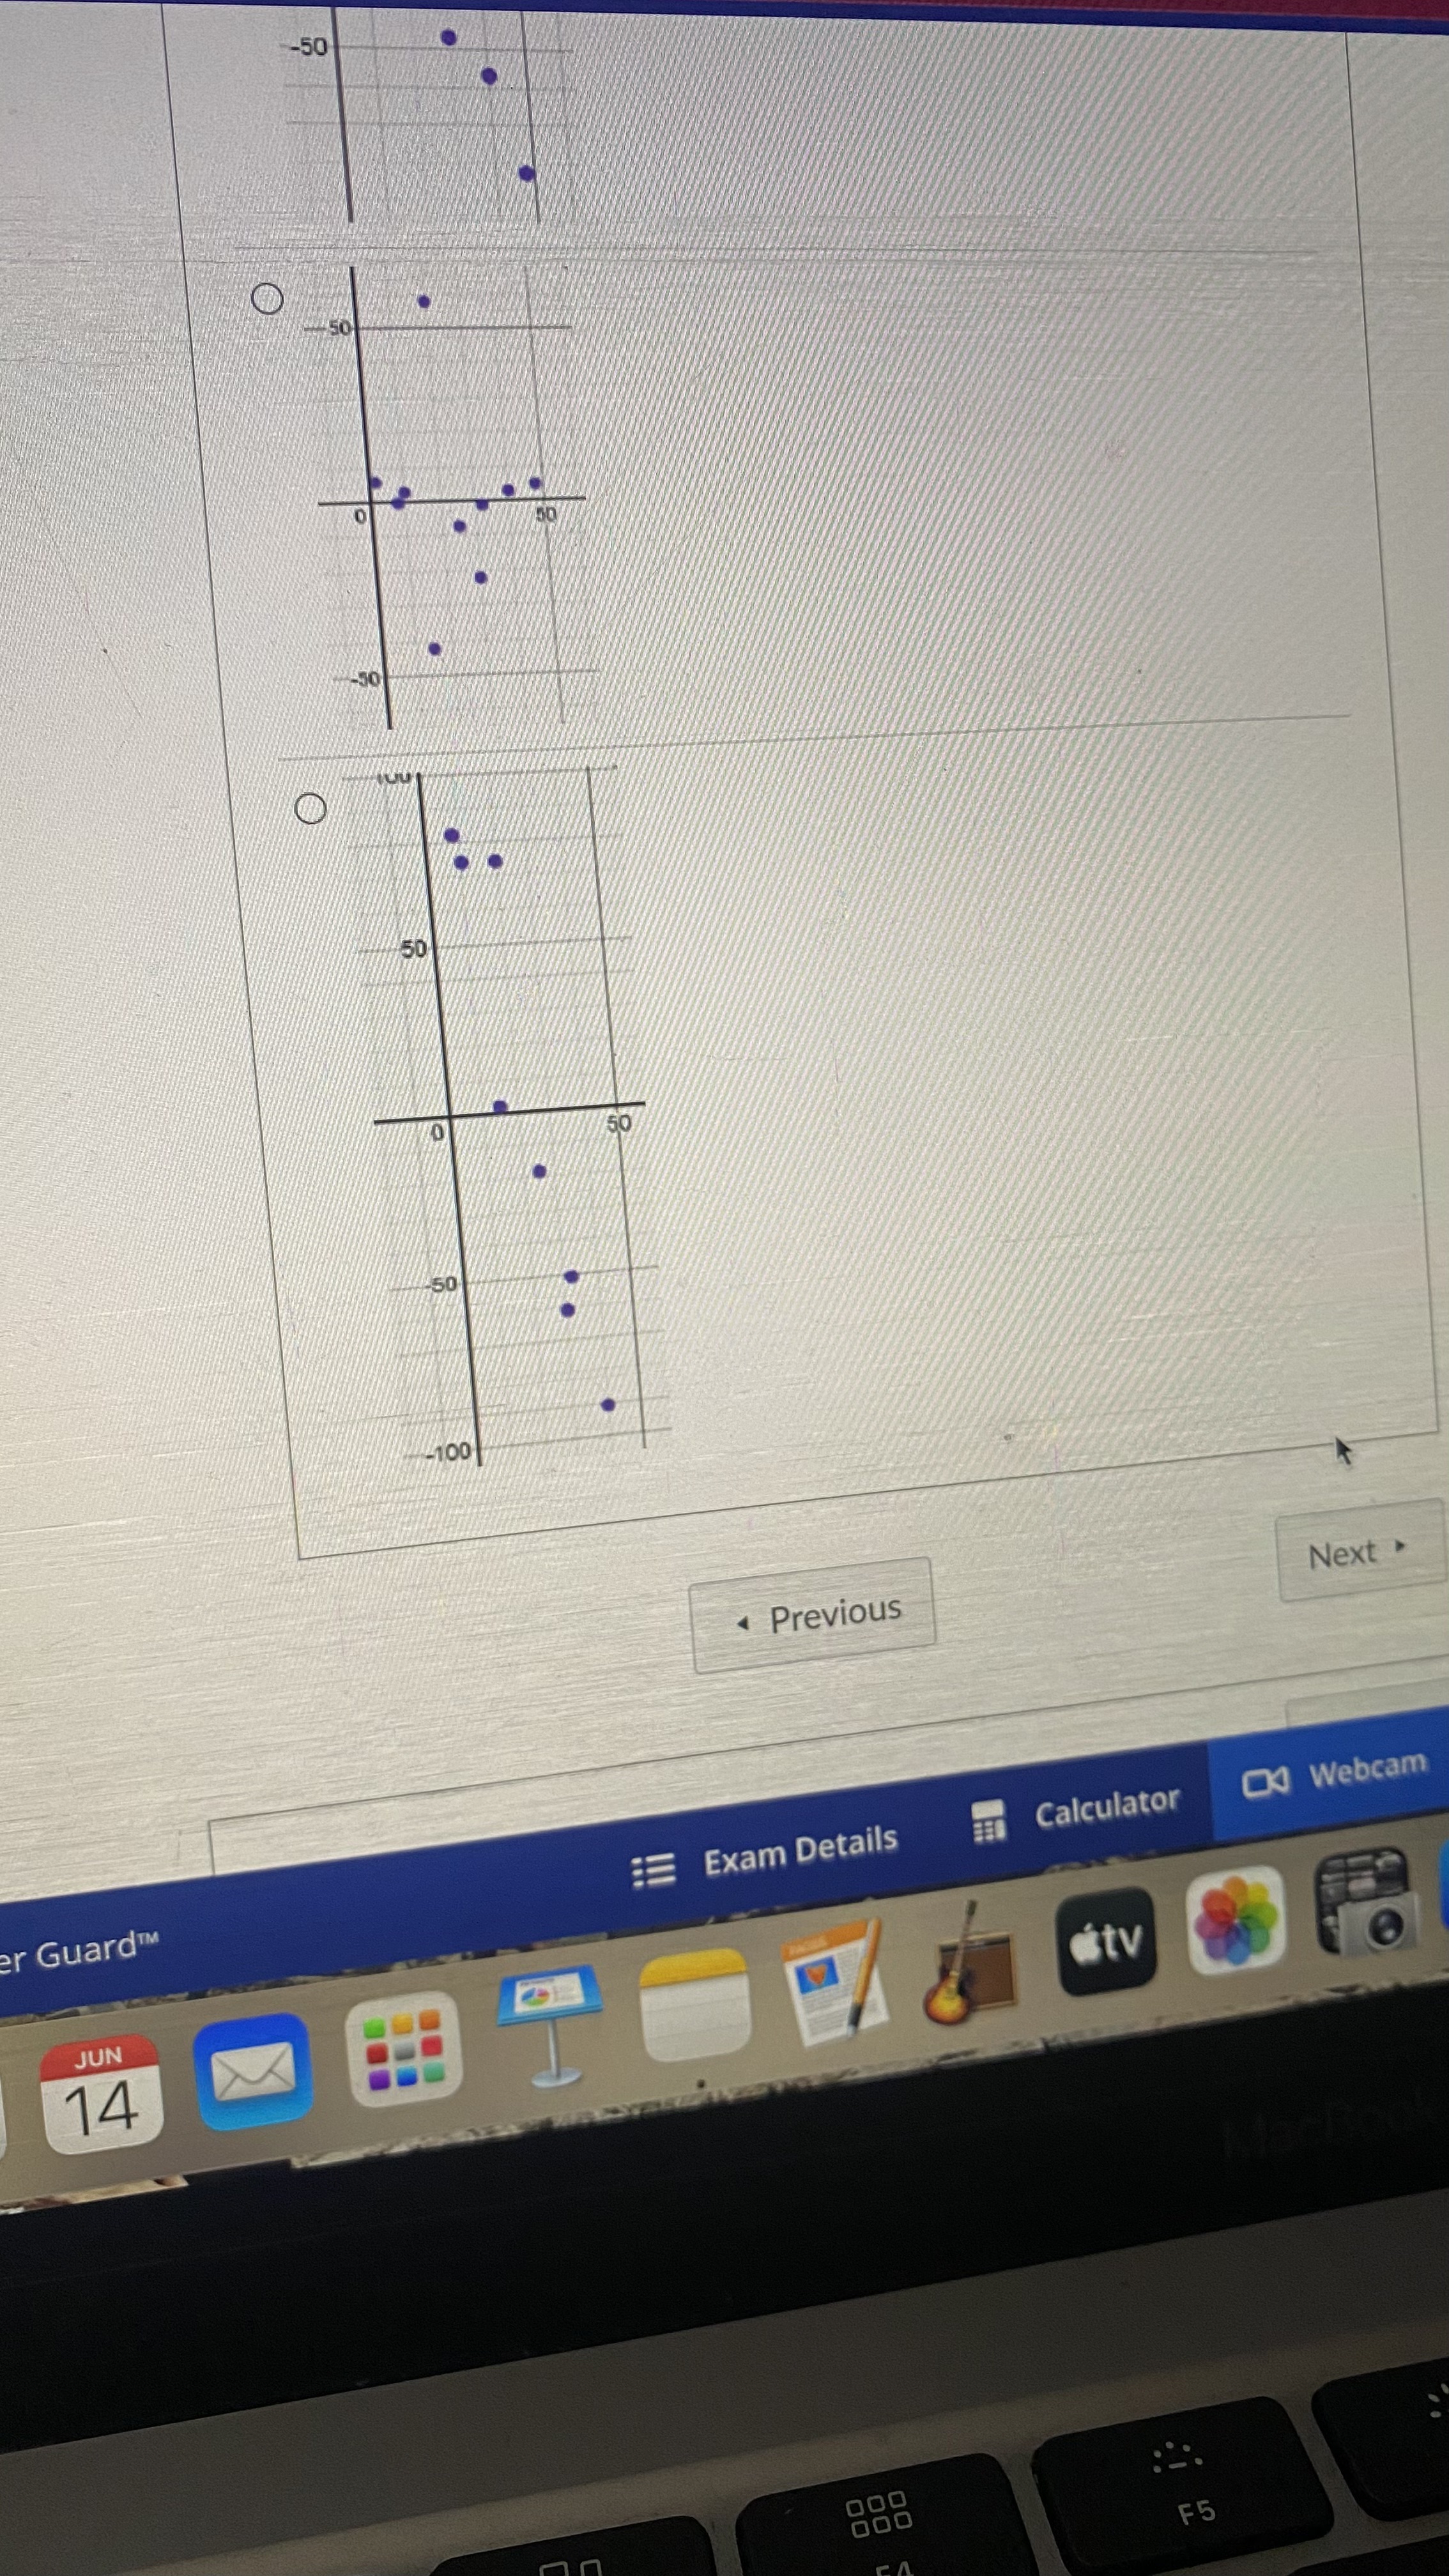
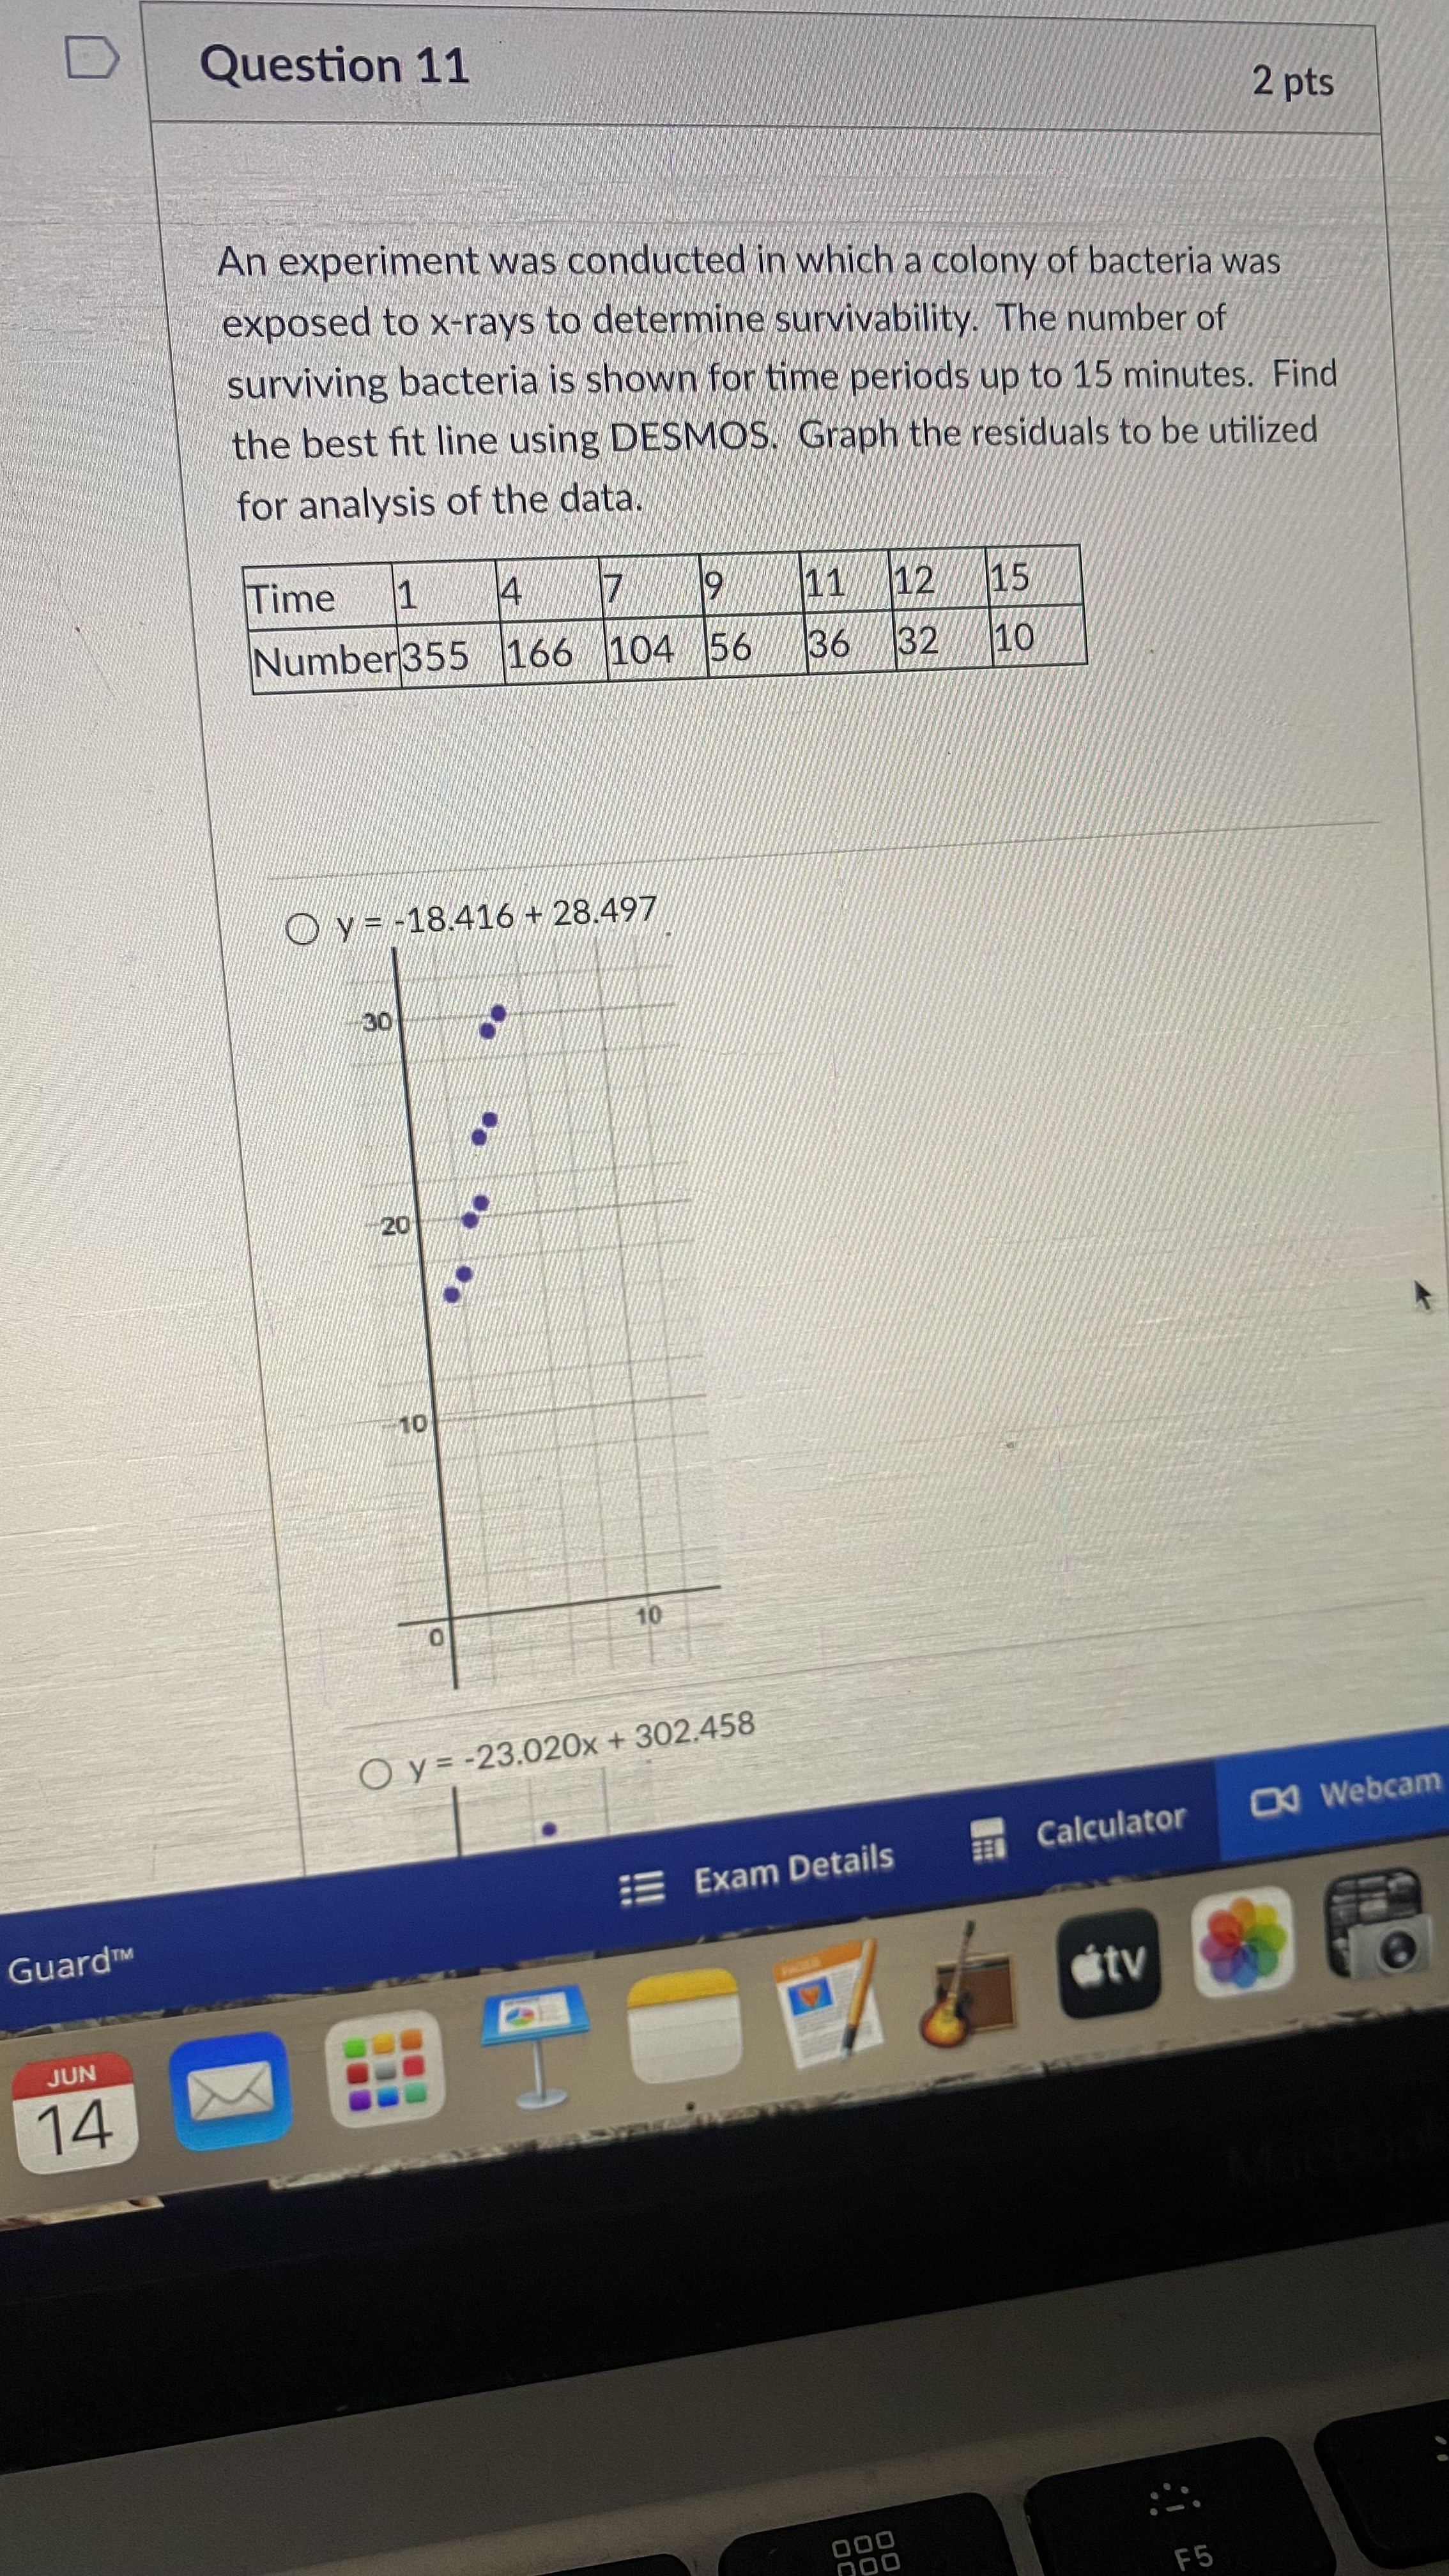
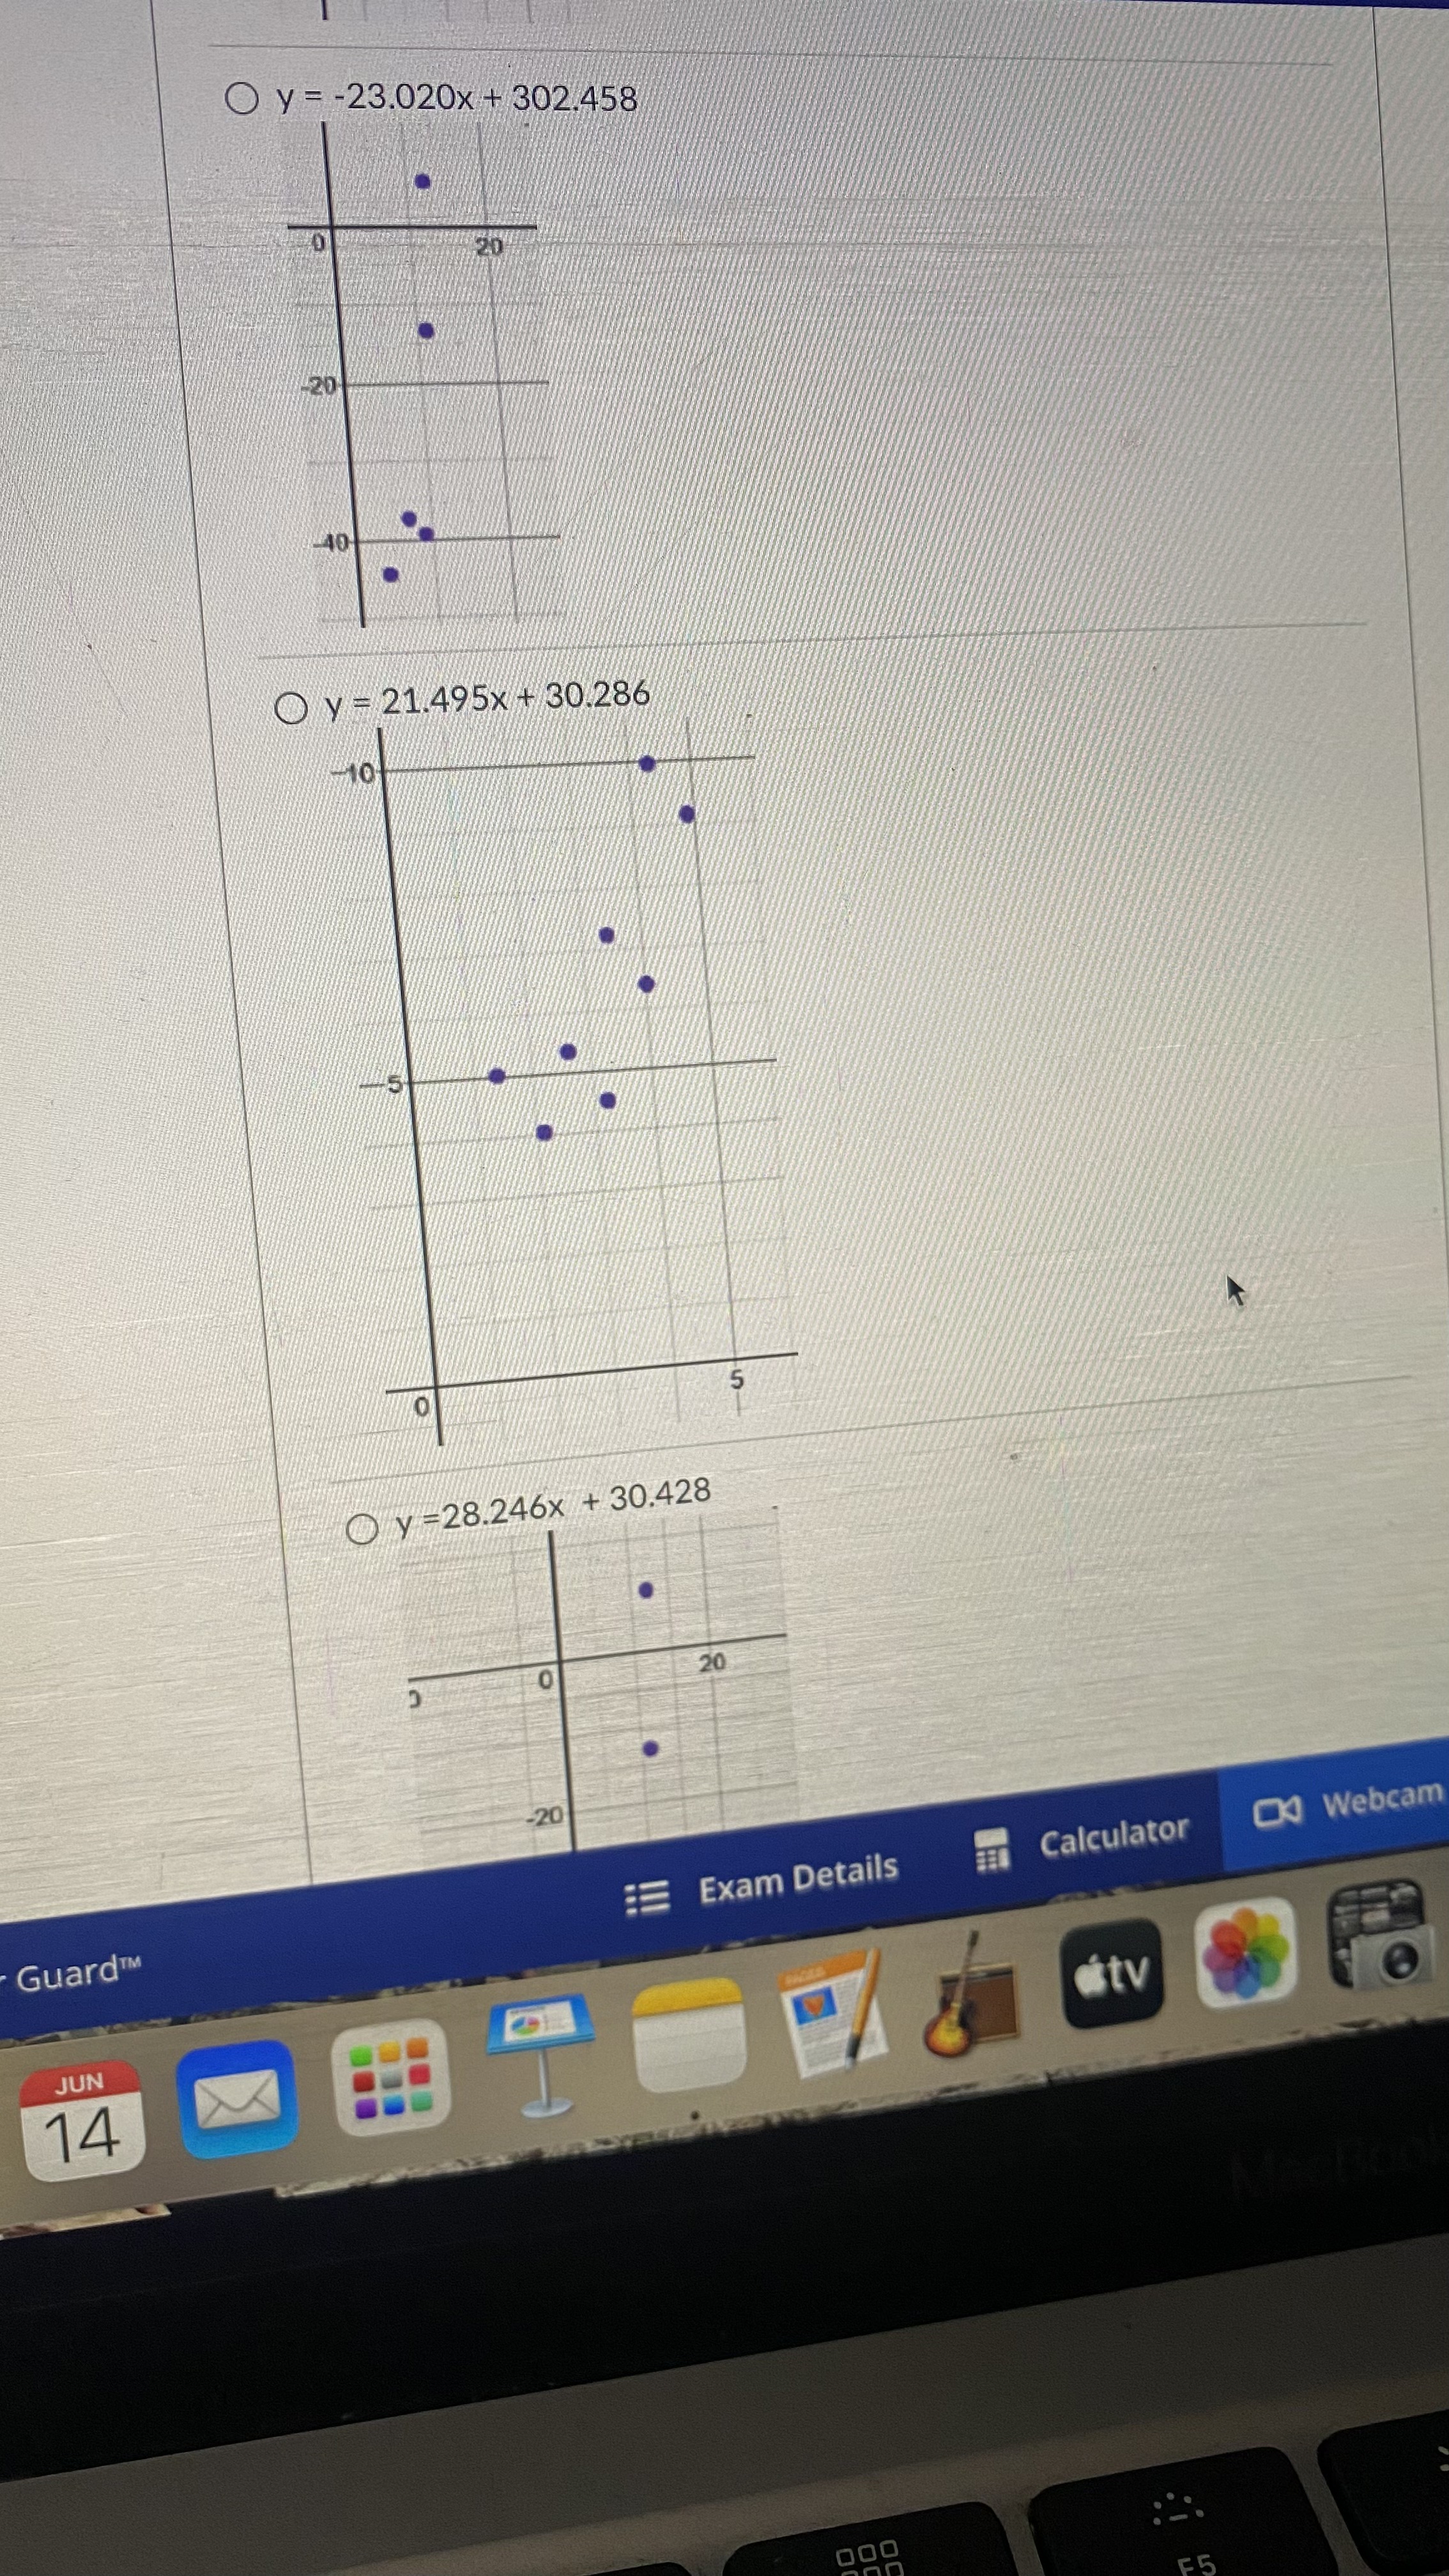
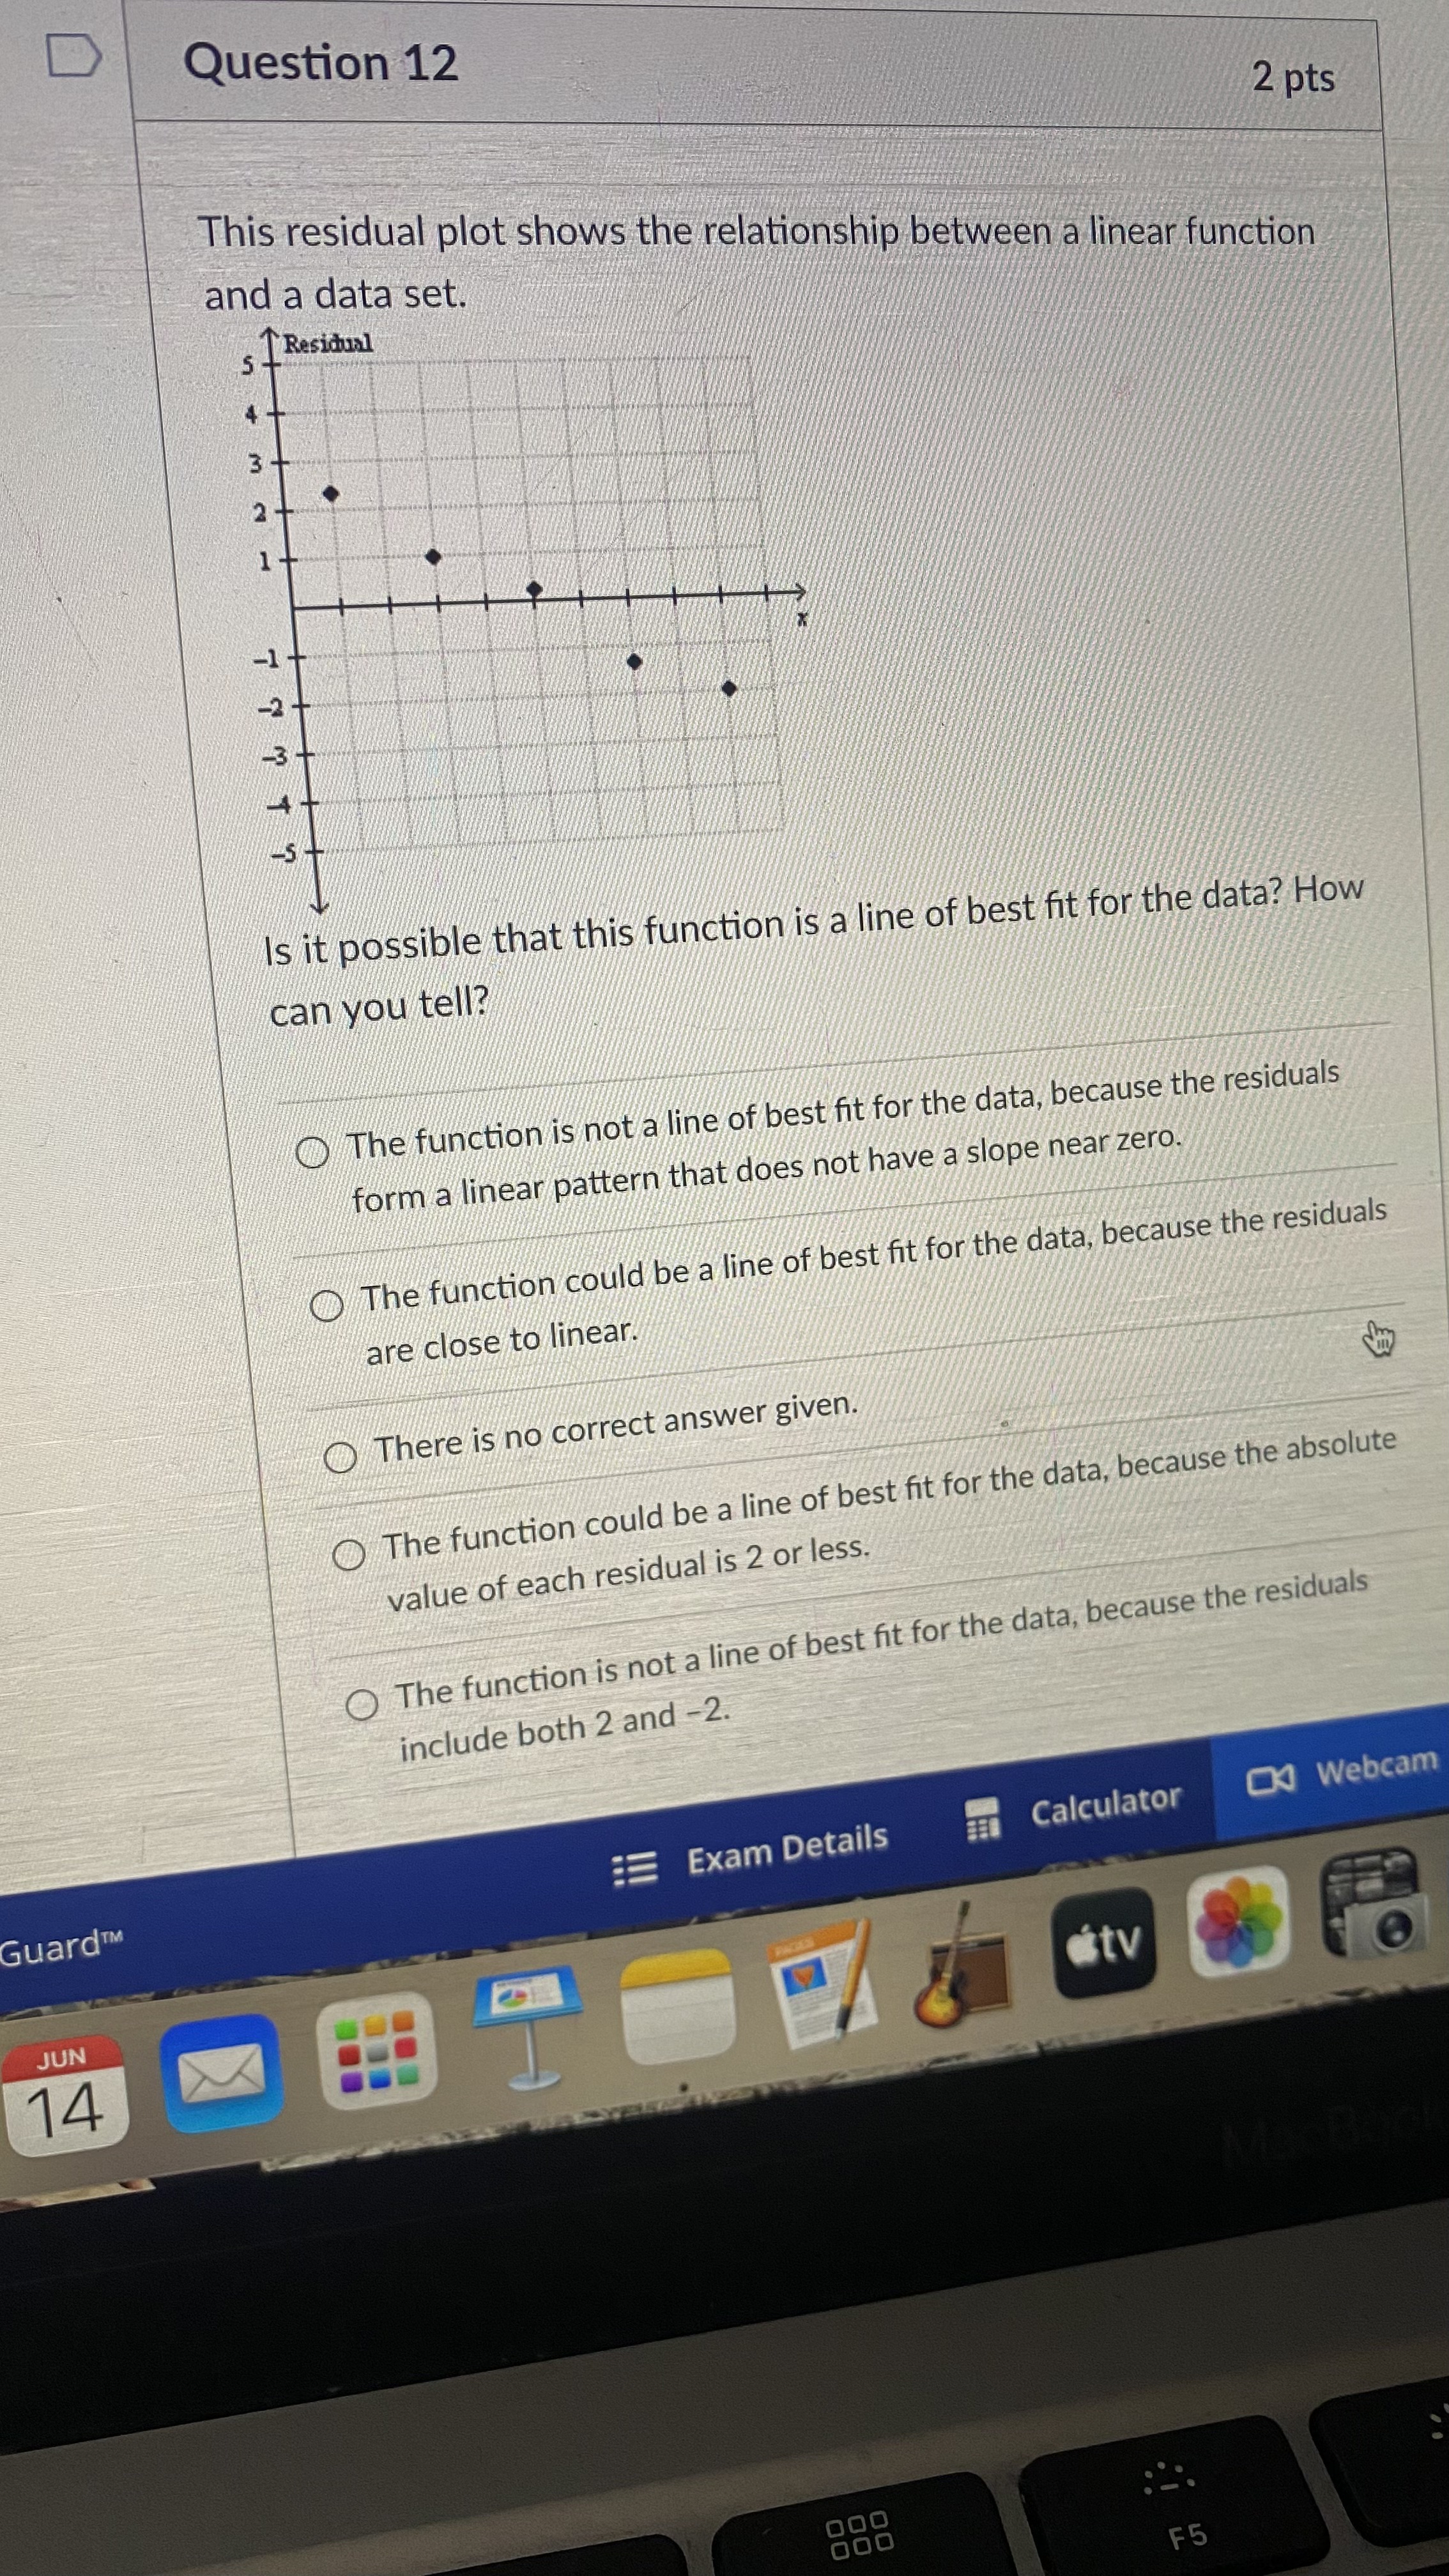
Suppose that the table shows the prices of milk and apples for 8 supermarkets. The equation for the least squares line for the data is data set. y 1.18x + 1.37 and / & 0.91. Discuss correlation and causation for the Price, One Pound Red $0.99 $1.29$1.19$1.09$0.99$1.29$1.29$1.19 Delicious Apples Price, One $2.59 $2.89$2.69$2.55$2.59$2.99$2.89$2.79 Gallon Whole Milk There is a very weak positive correlation between the price of apples and the price of milk. There is not a likely cause-and-effect relationship because other factors, such as transportation costs, likely affect both apple and milk prices. There is a strong positive correlation between the price of apples and the price of milk. There is not a likely cause-and-effect relationship because other factors, such as transportation costs, likely affect both apple and milk prices. There is a strong positive correlation between the price of apples and the price of milk. There is a likely cause-and-effect relationship because shoppers often buy both apples and milk at the same time. There is a very weak positive correlation between the price of apples and the price of milk. There is a likely cause-and-effect relationship because shoppers often buy both apples and milk at the same time. Webcam Exam Details Calculator uardTM PAGES stv JUN 14following data, using x as t i necessary. / () Weak negative correlation () Strong positive correlation () Strong negative correlation O Weak positive correlation Calcu\\ato: ALY dent variable? Use technology if CK! (T4l am Question 3 2 pts You find a line of fit for a set of data and calculate that the correlation coefficient for the model is -0.34. Which statement best describes the fit of the model to the data? There is no correct answer given. The correlation coefficient suggests a strong negative correlation, so this model is a good fit for the data. The correlation coefficient suggests a strong positive correlation, so this model is a good fit for the data. The correlation coefficient suggests a weak positive correlation, so this model is a not a good fit for the data. The correlation coefficient suggests a weak negative correlation, so this model is a not a good fit for the data. Previous Next > Exam Details Calculator OK Webcam 000 F5Question 4 2 pts The table shows the relationship between weight and lifespan for several dog breeds. Find an equation of the line of best fit and the correlation coefficient. How well does the line represent the data? Breed Typical Weight Typical Lifespan (pounds) (years) Yorkshire Terrier 5.5 15 Shih Tzu 12.5 13 Pug 16 13.5 Boston Terrier 20 13 Welsh Corgi 26 13 (Pembroke) Bulldog 45 7 Siberian Husky 47.5 12 Golden Retriever 65 12 German Shepherd 72.5 11 Dog 10 Rottweiler 107.5 135 8.5 Great Dane O Y & 0.04x+ 13.62 The value of r is about 0.71, which indicates a moderately positive correlation. OVN-0.04x+ 13.62 Calculator OK Webcam Exam Details rdTM "tv N 4G Image result for kr... Gmail YouTube Maps Breed Typical Weight Typical Lifespan (pounds) (years) Yorkshire Terrier 5.5 15 Shih Tzu 12.5 13 Pug 16 13.5 Boston Terrier 20 13 Welsh Corgi 26 13 (Pembroke) Bulldog 45 7 Siberian Husky 47.5 12 Golden Retriever 65 12 German Shepherd 72.5 11 Dog Rottweiler 107.5 10 Great Dane 135 8.5 O y & 0.04x + 13.62 The value of r is about 0.71, which indicates a moderately positive correlation. O Y&-0.04x + 13.62 The value of r is about -0.71, which indicates that weight and lifespan are not correlated. O YN-0.4x + 13.62 The value of r is about 0.49, which indicates a slightly negative correlation. O YN-0.04x + 13.62 The value of r is about -0.71, which indicates a moderately negative correlation. Exam Details Calculator OJ Webcam ard TM tv JUN 4 MacBookQuestion 5 2 pts The data set shows the amount of funds raised and the number of participants in the fundraiser at the Family House organization branches. Make a scatter plot of the data with number of participants as the independent variable. Then, find the correlation coefficient and the equation of the line of best fit and draw the line. Family House Fundraiser Number of participants 6 10 15 20 25 13 15 18 Funds raised ($) 450 550 470 550 650 600 600 650 1000 900 800 700 600 500 Money raised ($) 400 300 200 100 6 9 12 15 18 21 24 2 Number of participants y - 8.5x +435.3; ~ ~ 0.66 O 30 ticip ants Calculator Webcam dTM Exam Details utv200 100 6 9 12 15 18 21 24 27 Number of participants y - 8.5x + 43513 0.66 30 Number of particip ants 100 200/300 400 500 600 700 800 900 Money raised ($) y - 0.05x - 14.28; ~ ~ 0.66 1000 900 800 700 600 Money raised ($) 400 300 200 100 3 6 9 12 15 18 21 24 27 Number of participants y = 9.3x + 422.8; / N 0.73 O 1000 900 - 800 700 Guard TM Exam Details Calculator CX Webcam JUN 14 utvy = 0.05x - 14.28; ~ 0.66 1000 900 800 700 3 600 Money raised ($ 500 400 - 300 200 - 100- 3 6 9 12 15 18 21 24 27 Number of participants y = 9.3x+422.8:~ ~ 0.73 1000 - 900 800 4 700 600 Money raised ($) 400 300 200 100 3 6 9 12 15 18 21 24 27 Number of participants y - 8.4x + 450.3;~ ~ 0.76 Previous Next Quiz saved at 12.27am Calculator OK Webcam GuardTM Exam Details JUN tv 14Started: Jun 14 at 12:26pm Quiz Instructions Show Instructions Question 6 2 pts Find the approximate correlation coefficient for a linear model for the data. 0 -1 0 0.9 -0.9 Previous Next Exam Details Calculator Webcam GuardTM JUN stv 14 F6Create a residual plot for the table using the linear model y = 1.8x + 8. Age, x (months) O 2 3 4 5 Baby's Weight, y 7.5 9.5 117 13.1 15.2 16.5 (pounds) 5 5 -5 OJ Webcam Calculator Exam Details Guard TM atv JUN 14 000 F5. O Previous Next > Not saved Submit Q Guard TM Exam Details Calculator CJ Webcam JUN tv 14 OOO F5Question 8 | Over the last semester, Mr. Freitas kept track of the number of student absences. Now that 'the semester is over, he wants to see if there is a linear re\\ationship between the number of absences and a student's grade for the semester. The data he collected are given in the table. reta residual plot of the data. Construct and interp aasl calculator o Jacob 88 Construct and interpret a residual plot of the data. 130 120 110 100 90 The residual plot is an upward drection. The plot is not linear. 10 -10 There is no pattern in the residual plot, so the data may be linearly related. Exam Details Calculator Webcam ser GuardTM JUN stv 14 OOO F5-10 related There is no pattern in the residual plot, so the data may be linearly O -10 There is a pattern in the residual plot, so the data is not linear. 10 There is no pattern in the residual plot, so the data is not linear. Previous Next ser Guard TM Exam Details Calculator CA Webcam JUN tv 14 000 000 F5Question 9 ] : Is there any relationship between the price of the ticket and the distance . from the soccer field? Assuming Tam going to gct a seat right at the half- way line (centered). And assuming that row 1/is close to the field and row 50 is further away up in the stands. Find the residuals = L ; -. calculator 7B L P 2 L = C'tvO O 50 50 -50 ser Guard TM Exam Details Calculator ON Webcam JUN tv 14 OOO 000 F5\fQuestion 10 2 pts Find the residual if you know the actual number is 5.2 and the predicted value is 4.8 O -0.5 2.2 0.4 1.4 Previous Next Not saved Subm Exam Details Calculator OK Webcar PAGES tv 000 20 OOO F5 F4 F3 F2 $ %D Question 11 2 pts An experiment was conducted in which a colony of bacteria was exposed to x-rays to determine survivability. The number of surviving bacteria is shown for time periods up to 15 minutes. Find the best fit line using DESMOS. Graph the residuals to be utilized for analysis of the data. Time 1 4 19 12 15 Number 355 166 104 56 36 32 10 y- -18.416 + 28.497 30 20 10 10 O y=-23.020x + 302.458 Calculator ON Webcam Exam Details GuardTM stv V JUN 14 OOO F 5\fD Question 12 2 pts This residual plot shows the relationship between a linear function and a data set. Residual 2 - Is it possible that this function is a line of best fit for the data? How can you tell? The function is not a line of best fit for the data, because the residuals form a linear pattern that does not have a slope near zero. The function could be a line of best fit for the data, because the residuals are close to linear. There is no correct answer given. The function could be a line of best fit for the data, because the absolute value of each residual is 2 or less. The function is not a line of best fit for the data, because the residuals include both 2 and -2. Exam Details Calculator OK Webcam Guard TM &tv JUN 14 000 000 F5
Step by Step Solution
There are 3 Steps involved in it
Step: 1
Get Instant Access to Expert-Tailored Solutions
See step-by-step solutions with expert insights and AI powered tools for academic success
Step: 2
Step: 3
Ace Your Homework with AI
Get the answers you need in no time with our AI-driven, step-by-step assistance