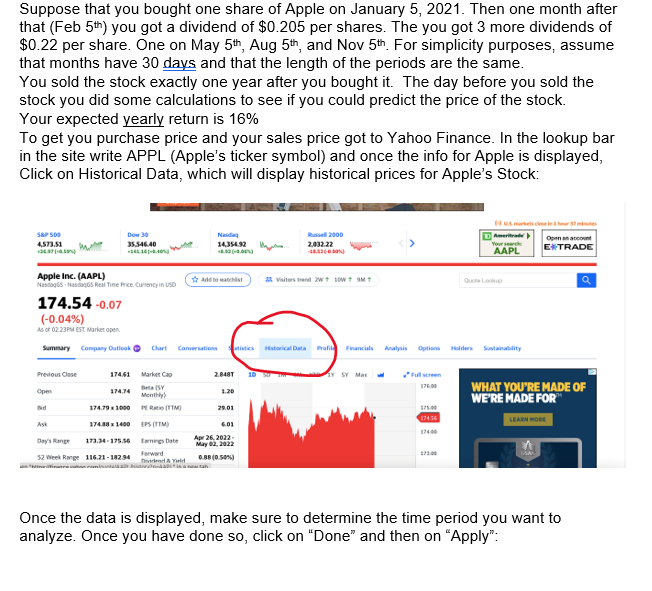
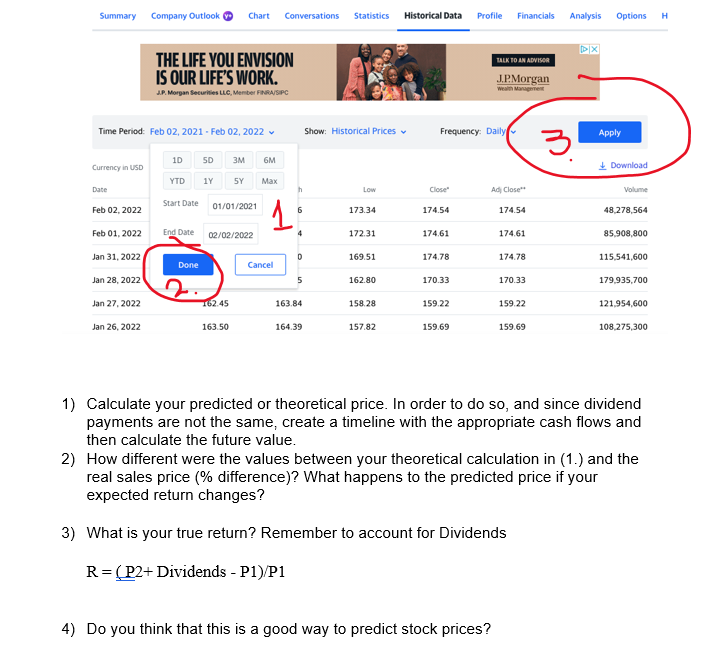
Suppose that you bought one share of Apple on January 5, 2021. Then one month after that (Feb 5th) you got a dividend of $0.205 per shares. The you got 3 more dividends of $0.22 per share. One on May 5th, Aug 5th, and Nov 5th. For simplicity purposes, assume that months have 30 days and that the length of the periods are the same. You sold the stock exactly one year after you bought it. The day before you sold the stock you did some calculations to see if you could predict the price of the stock. Your expected yearly return is 16% To get you purchase price and your sales price got to Yahoo Finance. In the lookup bar in the site write APPL (Apple's ticker symbol) and once the info for Apple is displayed, Click on Historical Data, which will display historical prices for Apple's Stock: S&P 500 4,573.51 +3637(-0.59) Dow 30 35,546.40 +436-640% Apple Inc. (AAPL) Nasdaq-Nasdaq Real Time Price Currency in USD Previous Close Open Bid Ask 174.61 174.74 174.79 x 1000 174.88 x 1400 Day's Range 173.34-175.56 52 Week Range 116.21-182.94 Nada 14,354.92 -8.50-40%) Market Cap Bet (5Y Monthly) PE Ratio (TTM) EPS (TTM) Earnings Date Forward Dvd & Yield Add to watchlist 174.54-0.07 (-0.04%) As of 02:23PM EST Market open Summary Company Outlook Chart Conversations atistics Historical Data Profil Financial Analysis Options Holders Sustainability 2.848T 1.20 29.01 Russell 2000 2,032.22 -48.53-6.50%) 6.01 Apr 26, 2022- May 02, 2022 0.88 (0.50%) 23 Visitors trand 2W + 10W + MT Y SY Max 176.00 175.00 174.56 174.00 Ameritrade Your search AAPL 173.00 Quote Lookup Open an account EXTRADE a WHAT YOU'RE MADE OF WE'RE MADE FOR LEARN MORE Once the data is displayed, make sure to determine the time period you want to analyze. Once you have done so, click on "Done" and then on "Apply": Summary Company Outlook Chart Time Period: Feb 02, 2021 - Feb 02, 2022 Currency in USD Date Feb 02, 2022 Feb 01, 2022 Jan 31, 2022 Jan 28, 2022 Jan 27, 2022 Jan 26, 2022 THE LIFE YOU ENVISION IS OUR LIFE'S WORK. J.P. Morgan Securities LLC, Member FINRA/SIPC 1D YTD Start Date End Date Done SD 3M 1Y SY 01/01/2021 02/02/2022 162.45 163.50 6M Max Conversations Statistics Historical Data Profile Financials Analysis Options Cancel h 6 4 D 5 163.84 164.39 Show: Historical Prices Low 173.34 172.31 169.51 162.80 158.28 157.82 Frequency: Daily Close" 174.54 174.61 174.78 170.33 159.22 159.69 TALK TO AN ADVISOR J.P.Morgan Wealith Managrment Ad Close** 174.54 4) Do you think that this is a good way to predict stock prices? 174.61 174.78 170.33 159.22 159.69 3 PX Apply Download Volume 48,278,564 85,908,800 115,541,600 179,935,700 121,954,600 108,275,300 1) Calculate your predicted or theoretical price. In order to do so, and since dividend payments are not the same, create a timeline with the appropriate cash flows and then calculate the future value. 2) How different were the values between your theoretical calculation in (1.) and the real sales price (% difference)? What happens to the predicted price if your expected return changes? 3) What is your true return? Remember to account for Dividends R = (P2+ Dividends - P1)/P1 H Suppose that you bought one share of Apple on January 5, 2021. Then one month after that (Feb 5th) you got a dividend of $0.205 per shares. The you got 3 more dividends of $0.22 per share. One on May 5th, Aug 5th, and Nov 5th. For simplicity purposes, assume that months have 30 days and that the length of the periods are the same. You sold the stock exactly one year after you bought it. The day before you sold the stock you did some calculations to see if you could predict the price of the stock. Your expected yearly return is 16% To get you purchase price and your sales price got to Yahoo Finance. In the lookup bar in the site write APPL (Apple's ticker symbol) and once the info for Apple is displayed, Click on Historical Data, which will display historical prices for Apple's Stock: S&P 500 4,573.51 +3637(-0.59) Dow 30 35,546.40 +436-640% Apple Inc. (AAPL) Nasdaq-Nasdaq Real Time Price Currency in USD Previous Close Open Bid Ask 174.61 174.74 174.79 x 1000 174.88 x 1400 Day's Range 173.34-175.56 52 Week Range 116.21-182.94 Nada 14,354.92 -8.50-40%) Market Cap Bet (5Y Monthly) PE Ratio (TTM) EPS (TTM) Earnings Date Forward Dvd & Yield Add to watchlist 174.54-0.07 (-0.04%) As of 02:23PM EST Market open Summary Company Outlook Chart Conversations atistics Historical Data Profil Financial Analysis Options Holders Sustainability 2.848T 1.20 29.01 Russell 2000 2,032.22 -48.53-6.50%) 6.01 Apr 26, 2022- May 02, 2022 0.88 (0.50%) 23 Visitors trand 2W + 10W + MT Y SY Max 176.00 175.00 174.56 174.00 Ameritrade Your search AAPL 173.00 Quote Lookup Open an account EXTRADE a WHAT YOU'RE MADE OF WE'RE MADE FOR LEARN MORE Once the data is displayed, make sure to determine the time period you want to analyze. Once you have done so, click on "Done" and then on "Apply": Summary Company Outlook Chart Time Period: Feb 02, 2021 - Feb 02, 2022 Currency in USD Date Feb 02, 2022 Feb 01, 2022 Jan 31, 2022 Jan 28, 2022 Jan 27, 2022 Jan 26, 2022 THE LIFE YOU ENVISION IS OUR LIFE'S WORK. J.P. Morgan Securities LLC, Member FINRA/SIPC 1D YTD Start Date End Date Done SD 3M 1Y SY 01/01/2021 02/02/2022 162.45 163.50 6M Max Conversations Statistics Historical Data Profile Financials Analysis Options Cancel h 6 4 D 5 163.84 164.39 Show: Historical Prices Low 173.34 172.31 169.51 162.80 158.28 157.82 Frequency: Daily Close" 174.54 174.61 174.78 170.33 159.22 159.69 TALK TO AN ADVISOR J.P.Morgan Wealith Managrment Ad Close** 174.54 4) Do you think that this is a good way to predict stock prices? 174.61 174.78 170.33 159.22 159.69 3 PX Apply Download Volume 48,278,564 85,908,800 115,541,600 179,935,700 121,954,600 108,275,300 1) Calculate your predicted or theoretical price. In order to do so, and since dividend payments are not the same, create a timeline with the appropriate cash flows and then calculate the future value. 2) How different were the values between your theoretical calculation in (1.) and the real sales price (% difference)? What happens to the predicted price if your expected return changes? 3) What is your true return? Remember to account for Dividends R = (P2+ Dividends - P1)/P1 H