

Question
Suppose that you have been given the table structure and data shown in the table below, which was imported from an Excel spreadsheet. The data
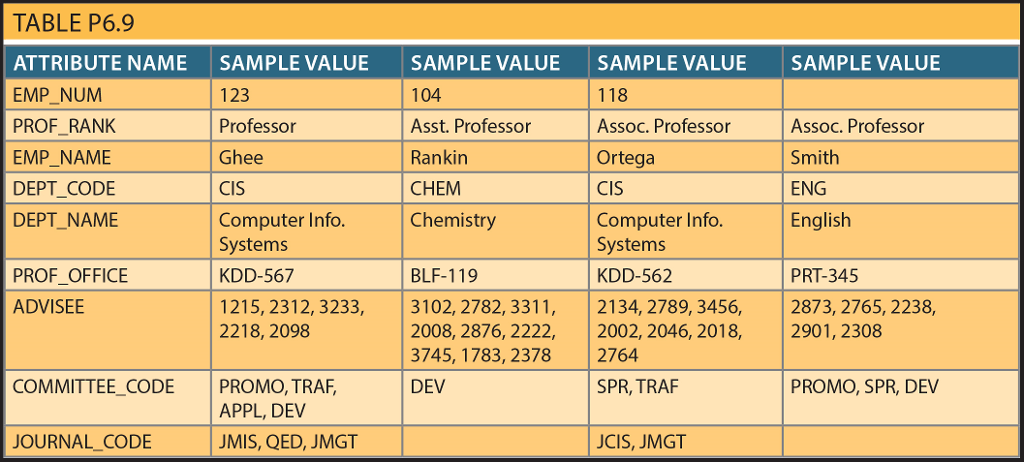
Suppose that you have been given the table structure and data shown in the table below, which was imported from an Excel spreadsheet. The data reflect that a professor can have multiple advisees, can serve on multiple committees, and can edit more than one journal.
Given the information in the table:
Draw the dependency diagram.
Identify the multivalued dependencies.
Create the dependency diagrams to yield a set of table structures in 3NF.
Eliminate the multivalued dependencies by converting the affected table structures to 4NF
Draw the Crows Foot ERD to reflect the dependency diagrams you drew in #3. (Note: You might have to create additional attributes to define the proper PKs and FKs. Make sure that all of your attributes conform to the naming conventions.)
TABLE P6.9 ATTRIBUTE NAME SAMPLE VALUE SAMPLE VALUE SAMPLE VALUE SAMPLE VALUE EMP NUM 123 104 118 Assoc. Professor Assoc. Professor PROF RANK Asst. Professor Professor EMP NAME Ghee Rankin Smith Ortega ENG DEPT CODE CHEM CIS CIS DEPT NAME Computer Info. Computer Info. Chemistry English Systems Systems KDD-567 PROF OFFICE BLF-119 PRT-345 KDD-562 ADVISEE 1215, 2312, 3233, 3102, 2782, 3311, 2134, 2789, 3456, 2873, 2765, 2238, 2218, 2098 2008, 2876, 2222, 2002, 2046, 2018, 2901, 2308 3745, 1783, 2378 2764 DEV SPR, TRAF COMMITTEE CODE PROMO, TRAF, PROMO, SPR, DEV APPL, DEV JCIS, JMGT JOURNAL CODE UMIS, QED, JMGTStep by Step Solution
There are 3 Steps involved in it
Step: 1

Get Instant Access to Expert-Tailored Solutions
See step-by-step solutions with expert insights and AI powered tools for academic success
Step: 2

Step: 3
Ace Your Homework with AI
Get the answers you need in no time with our AI-driven, step-by-step assistance
Get Started
Put Your Data To Work 52 Tips And Techniques For Effectively Managing Your Database
Authors: Wes Trochlil
1st Edition
0880343079, 978-0880343077