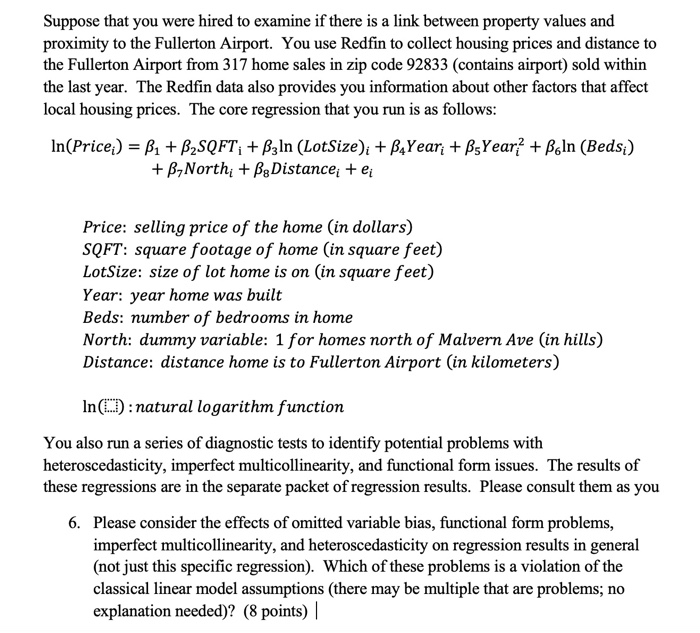
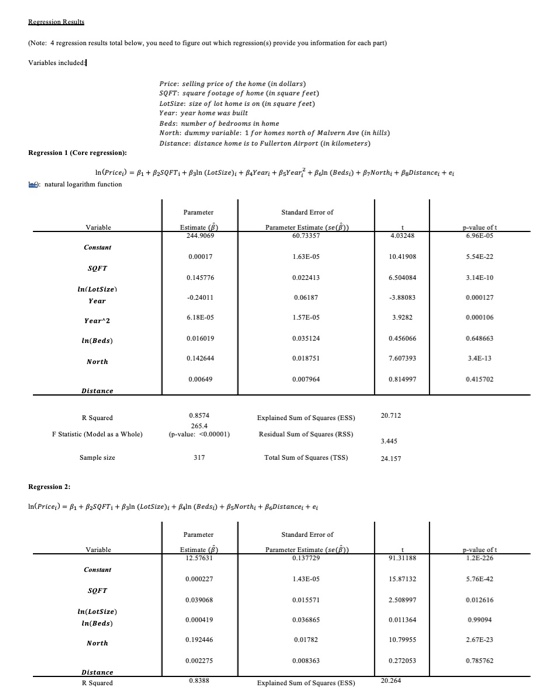
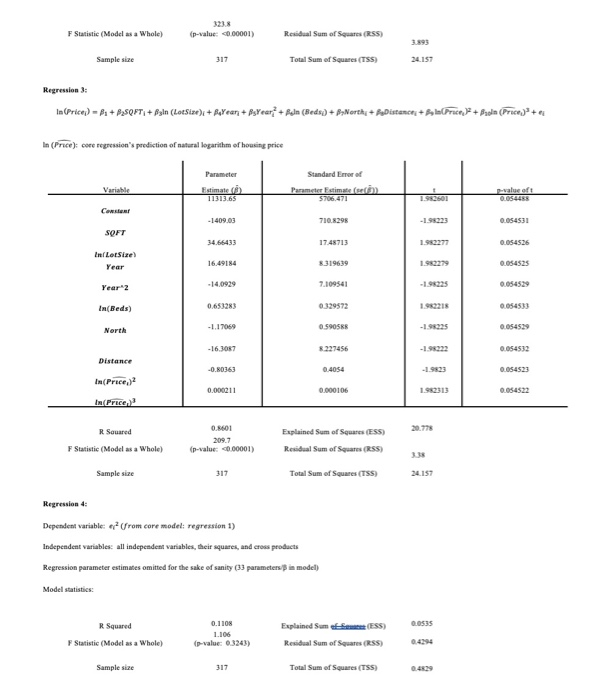
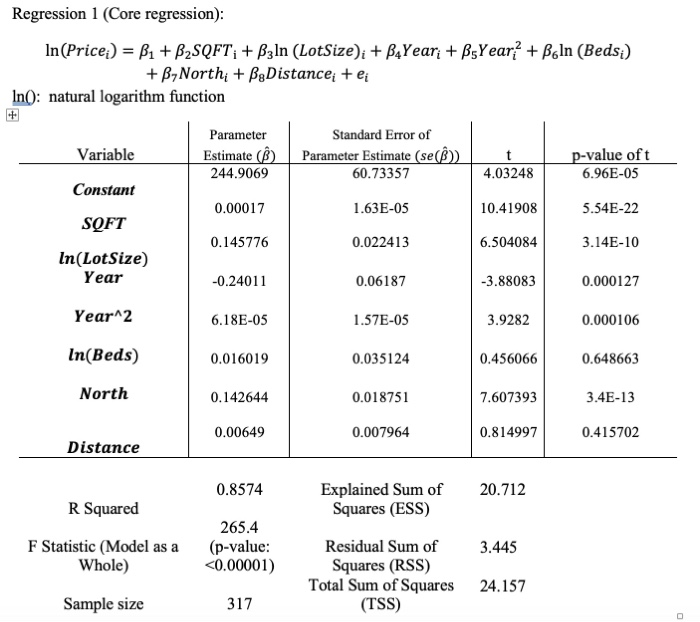
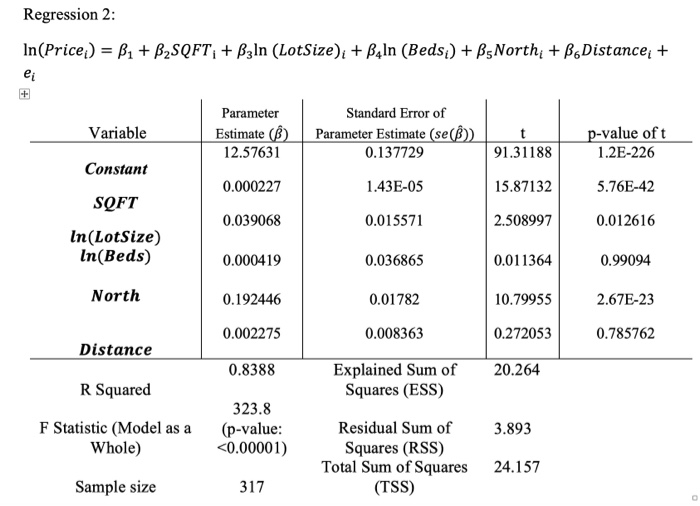
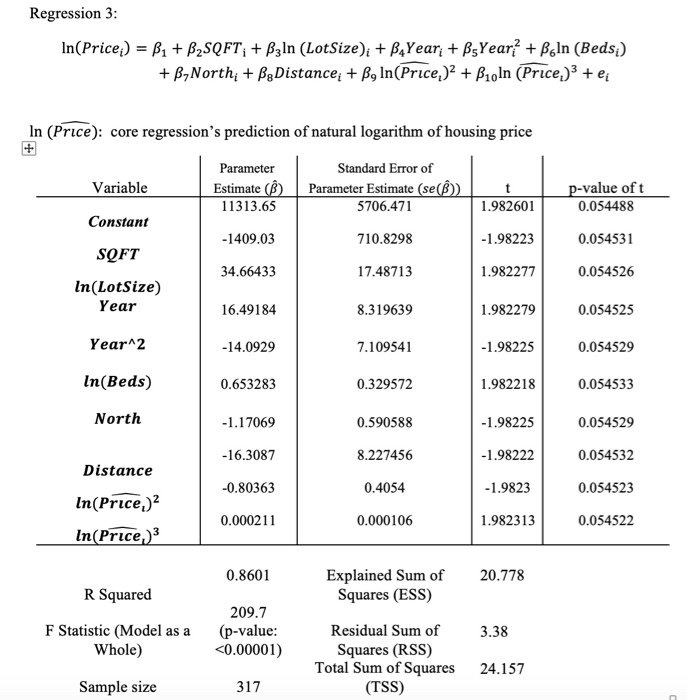
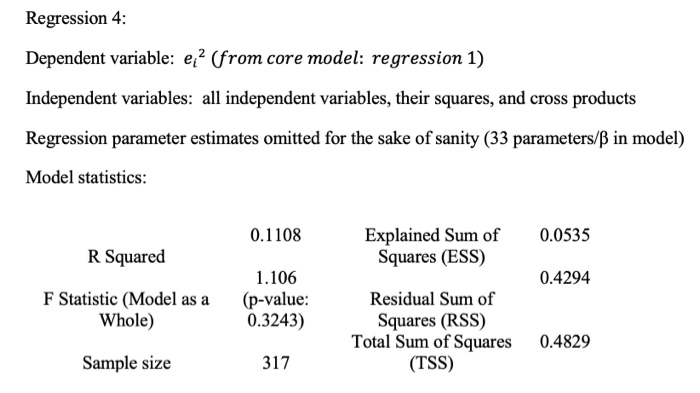
Suppose that you were hired to examine if there is a link between property values and proximity to the Fullerton Airport. You use Redfin to collect housing prices and distance to the Fullerton Airport from 317 home sales in zip code 92833 (contains airport) sold within the last year. The Redfin data also provides you information about other factors that affect local housing prices. The core regression that you run is as follows: In(Price;) = B1 + B2SQFT; + B3In (LotSize)i + B4Year; + BsYear + Boln (Beds;) + B,North + Bg Distance; + ei Price: selling price of the home (in dollars) SQFT: square footage of home (in square feet) LotSize: size of lot home is on (in square feet) Year: year home was built Beds: number of bedrooms in home North: dummy variable: 1 for homes north of Malvern Ave (in hills) Distance: distance home is to Fullerton Airport (in kilometers) In(O): natural logarithm function You also run a series of diagnostic tests to identify potential problems with heteroscedasticity, imperfect multicollinearity, and functional form issues. The results of these regressions are in the separate packet of regression results. Please consult them as you 6. Please consider the effects of omitted variable bias, functional form problems, imperfect multicollinearity, and heteroscedasticity on regression results in general (not just this specific regression). Which of these problems is a violation of the classical linear model assumptions (there may be multiple that are problems; no explanation needed)? (8 points) (Note: 4 regression results total below, you need to figure out which regression(s) provide you information for each part) Variables included! Price: selling price of the home (in dollars) SQFT: square footage of home in square feet) LotSize: size of tot home is on (in square feet) Year: year home was built Beds: number of bedrooms in home North: dumy variable: 1 for homes north of Malwern Ave (in hills) Distances distance home is to Fullerton Airport (in kilometers) Regression (Core regressions In(Price) A2+B_SQFT, + Bain (LotSize) + B4Yean +BsYear: + Bulin (Beds) + 8yNorthy + BuDistance + Ims natural logarithm function Parameter Estimate) Variable Standard Error of Parameter stimate 60.73357 prasoft 6.96E-6S Constant 0.00017 1.63E-OS 10.41908 S.54E-22 SOFT 0.145776 0.022413 6.564084 3.14E-10 In LetSize) Year -0.24011 0.06187 -3.80 0.000127 6.180-05 1.57E-05 3.9262 Year 2 0.000105 In(Beds) 0.016019 0.035124 0.456066 0.648663 0.14264 North 0.018751 7.607393 0,00649 0.007964 0.814997 0.415702 Distance 0.8574 20.712 R Squared Statistic (Model as a Whole) Explained Sum of Squares (ESS) Residual Sum of Squares (RSS) (p-value: 0.00001) 3.445 Sample size 317 Total Sum of Squares (TSS) 24.157 Regression 21 InPrice:) - B1 + B250FT,+Byla (LatSize)+ Reln (Beds:) + B Northe + PsDistance + Parameter Standard Error of Parameter Estimate Variable Estimale) 12:37631 9131188 CORSI 0.000227 143E- 15.87132 5.765-42 SOFT 0.039068 0.015571 0.012616 In(LotSize) In(Beds) 0.000419 0.036865 0,011364 0.99094 North 0.192446 0.01782 10.79955 2.67E-23 0.002275 0.008363 0.272053 0.785762 Distance R Squared 0.8388 20264 Explained Sum of Squares (ESS) F Statistic (Model as a Whole) (p-value: 0.00001) Residual Sum of Squares (RSS) Total Sum of Squares (TSS) Sample size 317 24.157 Regression 3: In(price $1 + P3SQFT + Bln (LotSize): + PaYear: + BxYear + Plin (Beds) + B>Norths + PaDistance: + Blarice? + Badia (Price) + In (Proce): core regression's prediction of natural logarithm of housing price Variable Parameter Fistimate 11313.65 Standard Ener of Parameter stimule 5706,471 p-value oft 0.054458 -1 409.03 710.8298 -1.95223 0.054531 SOFT 34.66433 17.48713 0.054526 Ini Letsive Year 16.49184 8319639 1.950279 0.054525 Year 2 -14.0929 7.109541 -1.95225 0.054529 In(Beds) 0653283 0.329572 0.054533 North -1.17069 0.5905 -19925 0.054529 -16.3057 8.227456 0.054532 Distance -0.80363 0.4054 -1.9523 0.054523 In(Price In(Price 0.000211 0.000106 1.962313 0.054522 R Squared F Statistic (Model as a Whole) 0.8601 209.7 (p-value 0.00001) Explained Sum of Squares (ESS) Residual Sum of Squares (RSS) Sample size 317 Total Sum of Squares (TSS) 24.157 Regression 4: Dependent variable: ev? Urom core model: regression 1) Independent variables: all independent variables, their squares, and cross products Regression parameter estimates omitted for the sake of sanity (13 parametersi in model) Model statistics: 0.0535 R Squared Statistic (Model as a Whole) 0.110N 1.106 (p-value 0.3243) Explained Summer (ESS) Residual Sum of Squares (RSS) Sample size 317 Total Sum of Squares (TSS) Regression Results (Note: 4 regression results total below, you need to figure out which regression(s) provide you information for each part) Variables included: Price: selling price of the home in dollars) SQFT: square footage of home (in square feet) LotSize: size of lot home is on (in square feet) Year: year home was built Beds: number of bedrooms in home North: dummy variable: 1 for homes north of Malvern Ave (in hills) Distance: distance home is to Fullerton Airport (in kilometers) Regression 1 (Core regression) In(Price;) = B1 + B2SQFT; + Bzln (LotSize)i + BAYear; + BsYear + Boln (Beds;) + B,North; + BgDistance: + ei In(): natural logarithm function Variable Parameter Standard Error of Estimate (f) Parameter Estimate (se(f)) 244.9069 60.73357 p-value oft 6.96E-05 4.03248 Constant 0.00017 1.63E-05 10.41908 5.54E-22 SQFT 0.145776 0.022413 6.504084 3.14E-10 In(LotSize) Year -0.24011 0.06187 -3.88083 0.000127 Year 2 6.18E-05 1.57E-05 3.9282 0.000106 In(Beds) 0.016019 0.035124 0.456066 0.648663 North 0.142644 0.018751 7.607393 3.4E-13 0.00649 0.007964 0.814997 0.415702 Distance 0.8574 20.712 R Squared Explained Sum of Squares (ESS) 265.4 (p-value: Norths + PaDistance: + Blarice? + Badia (Price) + In (Proce): core regression's prediction of natural logarithm of housing price Variable Parameter Fistimate 11313.65 Standard Ener of Parameter stimule 5706,471 p-value oft 0.054458 -1 409.03 710.8298 -1.95223 0.054531 SOFT 34.66433 17.48713 0.054526 Ini Letsive Year 16.49184 8319639 1.950279 0.054525 Year 2 -14.0929 7.109541 -1.95225 0.054529 In(Beds) 0653283 0.329572 0.054533 North -1.17069 0.5905 -19925 0.054529 -16.3057 8.227456 0.054532 Distance -0.80363 0.4054 -1.9523 0.054523 In(Price In(Price 0.000211 0.000106 1.962313 0.054522 R Squared F Statistic (Model as a Whole) 0.8601 209.7 (p-value 0.00001) Explained Sum of Squares (ESS) Residual Sum of Squares (RSS) Sample size 317 Total Sum of Squares (TSS) 24.157 Regression 4: Dependent variable: ev? Urom core model: regression 1) Independent variables: all independent variables, their squares, and cross products Regression parameter estimates omitted for the sake of sanity (13 parametersi in model) Model statistics: 0.0535 R Squared Statistic (Model as a Whole) 0.110N 1.106 (p-value 0.3243) Explained Summer (ESS) Residual Sum of Squares (RSS) Sample size 317 Total Sum of Squares (TSS) Regression Results (Note: 4 regression results total below, you need to figure out which regression(s) provide you information for each part) Variables included: Price: selling price of the home in dollars) SQFT: square footage of home (in square feet) LotSize: size of lot home is on (in square feet) Year: year home was built Beds: number of bedrooms in home North: dummy variable: 1 for homes north of Malvern Ave (in hills) Distance: distance home is to Fullerton Airport (in kilometers) Regression 1 (Core regression) In(Price;) = B1 + B2SQFT; + Bzln (LotSize)i + BAYear; + BsYear + Boln (Beds;) + B,North; + BgDistance: + ei In(): natural logarithm function Variable Parameter Standard Error of Estimate (f) Parameter Estimate (se(f)) 244.9069 60.73357 p-value oft 6.96E-05 4.03248 Constant 0.00017 1.63E-05 10.41908 5.54E-22 SQFT 0.145776 0.022413 6.504084 3.14E-10 In(LotSize) Year -0.24011 0.06187 -3.88083 0.000127 Year 2 6.18E-05 1.57E-05 3.9282 0.000106 In(Beds) 0.016019 0.035124 0.456066 0.648663 North 0.142644 0.018751 7.607393 3.4E-13 0.00649 0.007964 0.814997 0.415702 Distance 0.8574 20.712 R Squared Explained Sum of Squares (ESS) 265.4 (p-value:
