Answered step by step
Verified Expert Solution
Link Copied!

Question

1 Approved Answer

Suppose the consumers' total income is 100TL. Find observations about expenditure and prices (annual average). You will use an area with food and non-alcoholic beverage

Suppose the consumers' total income is 100TL. Find observations about expenditure and prices (annual average). You will use an area with food and non-alcoholic beverage on the horizonal axis and the sum of all other goods on the vertical axis (please use the total prices of all other goods) ACCORD?NG TO THE DATA OF THE PHOTOA) For the assigned three years, please draw the revealed preferences diagram of the consumers for goods in your regions using the three year observation in the table. Can you tell anything about the welfare of the consumers? Are they better off or worse off in these years?
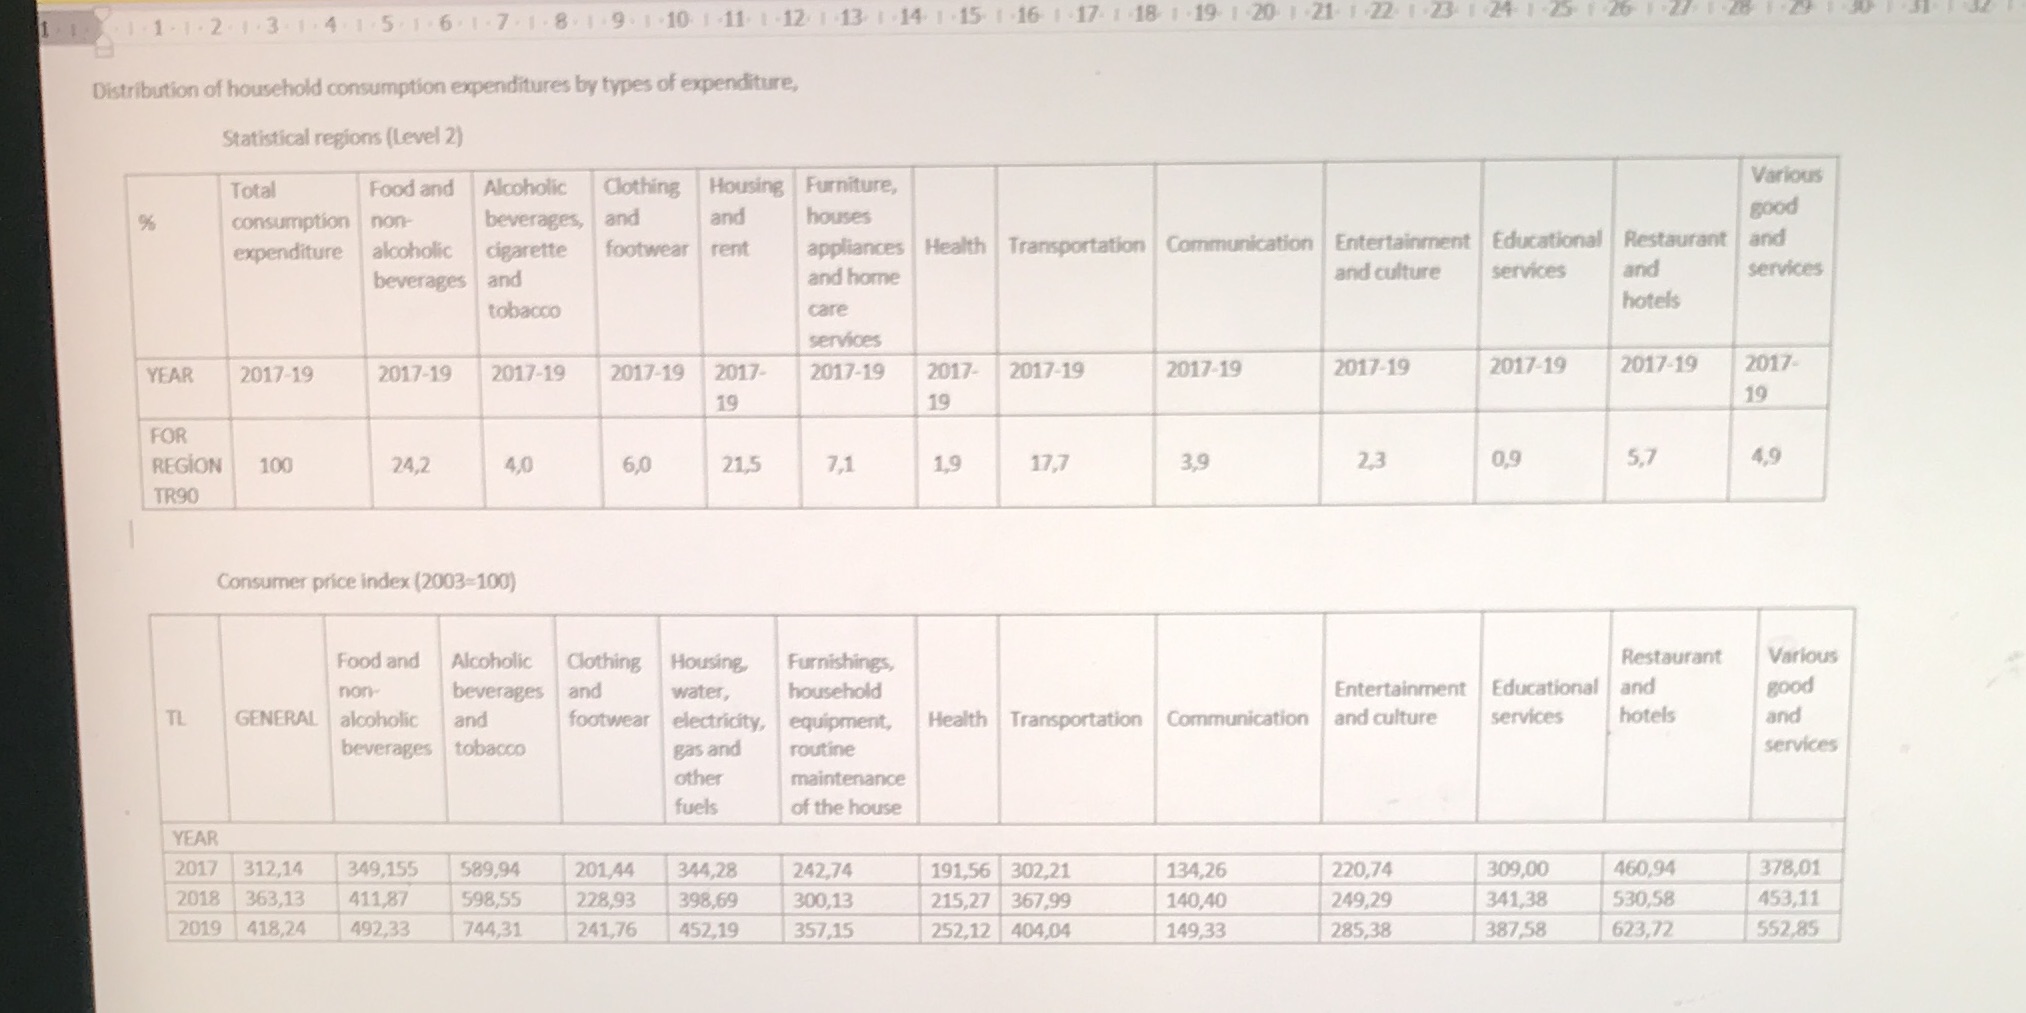
image text in transcribed
1 1 . 1 . 1 . 2 . 1 . 3 . 1 . 4 . 1 . 5 . 1 . 6 . 1 . 7 . 1 . 8 . 1. 9 . 1. 10. 1-11. 1-12 1.13 1. 14. 1. 15. 1.16 1.17 1.18 1 . 19 1.20. 1.21. 1.22. 1.23. 1 24 Distribution of household consumption expenditures by types of expenditure, Statistical regions (Level 2) Total Food and Alcoholic Clothing Housing Furniture, Various % consumption non- beverages, and and houses good expenditure alcoholic cigarette footwear rent appliances Health Transportation Communication Entertainment Educational |Restaurant and beverages and and horne and culture services and services tobacco care hotels services YEAR 2017-19 2017-19 2017-19 2017-19 2017- 2017-19 2017- 2017-19 2017-19 2017-19 2017-19 2017-19 2017- 10 10 19 FOR REGION 100 24,2 4.0 6,0 21.5 7.1 19 17,7 3.9 23 0.9 5.7 4.9 TR90 Consumer price index (2003-100) Food and Alcoholic Clothing Housing Furnishings, Restaurant Various non- beverages and water, household Entertainment Educational and good TL GENERAL alcoholic and footwear electricity, equipment, Health Transportation Communication and culture services hotels and beverages tobacco gas and routine services other maintenance fuels of the house YEAR 2017 312,14 349,155 589,94 201,44 344,28 242,74 191,56 302,21 134,26 220,74 309,00 460.94 378,01 2018 363,13 411,87 598,55 228,93 398,69 300,13 215,27 367,99 140,40 249,29 341,38 530.58 453,11 2019 418,24 492,33 744,31 241,76 452,19 357,15 252,12 404,04 149,33 285,38 387,58 623,72 552,85

Step by Step Solution

There are 3 Steps involved in it

Step: 1

blur-text-image

Get Instant Access to Expert-Tailored Solutions

See step-by-step solutions with expert insights and AI powered tools for academic success

Step: 2

blur-text-image

Step: 3

blur-text-image

Ace Your Homework with AI

Get the answers you need in no time with our AI-driven, step-by-step assistance

Get Started

Recommended Textbook for

International Economics Theory and Policy

Authors: Paul R. Krugman, Maurice Obstfeld, Marc J. Melitz

9th Edition

978-0132146654, 0132146657, 9780273754091, 978-0273754206

More Books

Students also viewed these Economics questions

Question

1. Television more Over watching faceing of many problems ?

Answered: 1 week ago

Question

Is there a link between chronic stress and memory function?

Answered: 1 week ago

Question

=+ c. What happens to investment in Oceania?

Answered: 1 week ago