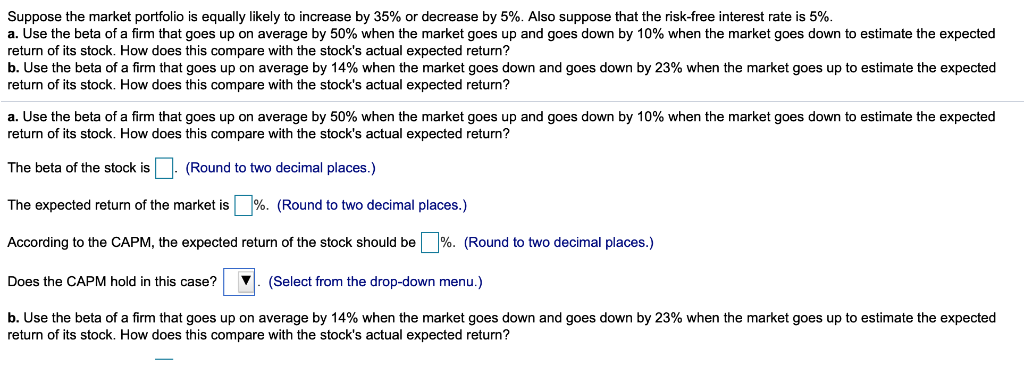
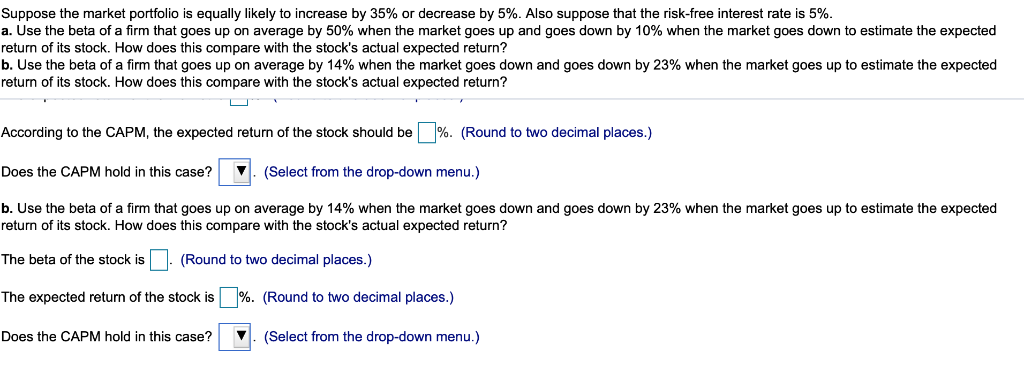
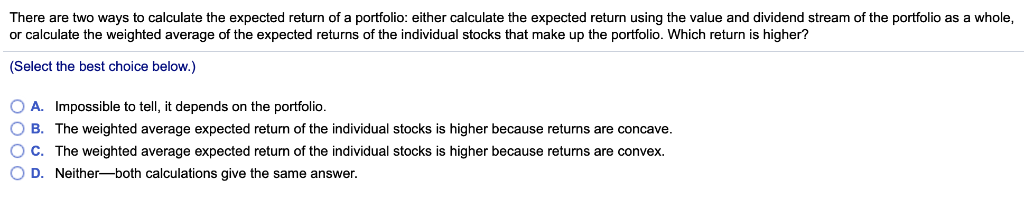
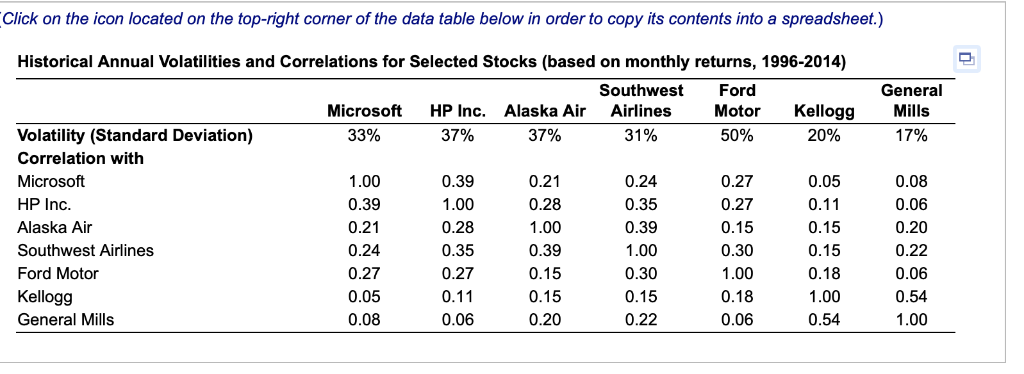
Suppose the market portfolio is equally likely to increase by 35% or decrease by 5%. Also suppose that the risk-free interest rate is 5%. a. Use the beta of a firm that goes up on average by 50% when the market goes up and goes down by 10% when the market goes down to estimate the expected return of its stock. How does this compare with the stock's actual expected return? b. Use the beta of a firm that goes up on average by 14% when the market goes down and goes down by 23% when the market goes up to estimate the expected return of its stock. How does this compare with the stock's actual expected return? a. Use the beta of a firm that goes up on average by 50% when the market goes up and goes down by 10% when the market goes down to estimate the expected return of its stock. How does this compare with the stock's actual expected return? The beta of the stock is(Round to two decimal places.) The expected return of the market is%" (Round to two decimal places.) According to the CAPM, the expected return of the stock should be 96 Round to two decimal places. Does the CAPM hold in this case?(Select from the drop-down menu.) b. Use the beta of a firm that goes up on average by 14% when the market goes down and goes down by 23% when the market goes up to estimate the expected return of its stock. How does this compare with the stock's actual expected return? Suppose the market portfolio is equally likely to increase by 35% or decrease by 5%. Also suppose that the risk-free interest rate is 5%. a. Use the beta of a firm that goes up on average by 50% when the market goes up and goes down by 10% when the market goes down to estimate the expected return of its stock. How does this compare with the stock's actual expected return? b. Use the beta of a firm that goes up on average by 14% when the market goes down and goes down by 23% when the market goes up to estimate the expected return of its stock. How does this compare with the stock's actual expected return? According to the CAPM, the expected return of the stock should be 9 Round to two decimal places. Does the CAPM hold in this case?(Select from the drop-down menu.) b. Use the beta of a firm that goes up on average by 14% when the market goes down and goes down by 23% when the market goes up to estimate the expected return of its stock. How does this compare with the stock's actual expected return? The beta of the stock is (Round to two decimal places.) The expected return of the stock is %. (Round to two decimal places.) Does the CAPM hold in this case? (Select from the drop-down menu.) There are two ways to calculate the expected return of a portfolio: either calculate the expected return using the value and dividend stream of the portfolio as a whole, or calculate the weighted average of the expected returns of the individual stocks that make up the portfolio. Which return is higher? (Select the best choice below.) O A. Impossible to tel, it depends on the portfolio O B. The weighted average expected return of the individual stocks is higher because returns are concave C. The weighted average expected return of the individual stocks is higher because retums are convex. O D. Neither-both calculations give the same answer. Using the data from the table, what is the volatility of an equally weighted portfolio of HP Inc. (HPQ), General Mills (GIS), and Microsoft (MSFT) stock? Hint: Make sure to round all intermediate calculations to at least four decimal places. The volatility of an equally weighted portfolio of the 3 stocks is % (Round to two decimal places.) Click on the icon located on the top-right corner of the data table below in order to copy its contents into a spreadsheet.) Historical Annual Volatilities and Correlations for Selected Stocks (based on monthly returns, 1996-2014) Southwest Ford Motor 60% General Kellogg Mills 17% Microsoft HP Inc. Alaska Air Airlines 33% 20% Volatility (Standard Deviation) Correlation with Microsoft HP Inc Alaska Air Southwest Airlines Ford Motor Kellogg General Mills 37% 37% 31% 1.00 0.39 0.21 0.24 0.27 0.05 0.08 0.39 1.00 0.28 0.35 0.27 0.11 0.06 0.24 0.35 0.39 1.00 0.30 0.15 0.22 0.27 0.27 0.15 0.30 1.00 0.18 0.06 0.05 0.11 0.15 0.15 0.18 1.00 0.54 0.08 0.06 0.20 0.22 0.06 0.54 1.00 0.21 0.28 1.00 0.39 0.15 0.15 0.20 Aluminum maker Alcoa has a beta of about 1.94, whereas Hormel Foods has a beta of 0.71. If the expected excess return of the market portfolio is 5%, which of these firms has a higher equity cost of capital, and how much higher is it? The firm that has the higher equity cost of capital is %. (Select from the drop-down menu and round to two decimal places.) by Suppose the market portfolio is equally likely to increase by 35% or decrease by 5%. Also suppose that the risk-free interest rate is 5%. a. Use the beta of a firm that goes up on average by 50% when the market goes up and goes down by 10% when the market goes down to estimate the expected return of its stock. How does this compare with the stock's actual expected return? b. Use the beta of a firm that goes up on average by 14% when the market goes down and goes down by 23% when the market goes up to estimate the expected return of its stock. How does this compare with the stock's actual expected return? a. Use the beta of a firm that goes up on average by 50% when the market goes up and goes down by 10% when the market goes down to estimate the expected return of its stock. How does this compare with the stock's actual expected return? The beta of the stock is(Round to two decimal places.) The expected return of the market is%" (Round to two decimal places.) According to the CAPM, the expected return of the stock should be 96 Round to two decimal places. Does the CAPM hold in this case?(Select from the drop-down menu.) b. Use the beta of a firm that goes up on average by 14% when the market goes down and goes down by 23% when the market goes up to estimate the expected return of its stock. How does this compare with the stock's actual expected return? Suppose the market portfolio is equally likely to increase by 35% or decrease by 5%. Also suppose that the risk-free interest rate is 5%. a. Use the beta of a firm that goes up on average by 50% when the market goes up and goes down by 10% when the market goes down to estimate the expected return of its stock. How does this compare with the stock's actual expected return? b. Use the beta of a firm that goes up on average by 14% when the market goes down and goes down by 23% when the market goes up to estimate the expected return of its stock. How does this compare with the stock's actual expected return? According to the CAPM, the expected return of the stock should be 9 Round to two decimal places. Does the CAPM hold in this case?(Select from the drop-down menu.) b. Use the beta of a firm that goes up on average by 14% when the market goes down and goes down by 23% when the market goes up to estimate the expected return of its stock. How does this compare with the stock's actual expected return? The beta of the stock is (Round to two decimal places.) The expected return of the stock is %. (Round to two decimal places.) Does the CAPM hold in this case? (Select from the drop-down menu.) There are two ways to calculate the expected return of a portfolio: either calculate the expected return using the value and dividend stream of the portfolio as a whole, or calculate the weighted average of the expected returns of the individual stocks that make up the portfolio. Which return is higher? (Select the best choice below.) O A. Impossible to tel, it depends on the portfolio O B. The weighted average expected return of the individual stocks is higher because returns are concave C. The weighted average expected return of the individual stocks is higher because retums are convex. O D. Neither-both calculations give the same answer. Using the data from the table, what is the volatility of an equally weighted portfolio of HP Inc. (HPQ), General Mills (GIS), and Microsoft (MSFT) stock? Hint: Make sure to round all intermediate calculations to at least four decimal places. The volatility of an equally weighted portfolio of the 3 stocks is % (Round to two decimal places.) Click on the icon located on the top-right corner of the data table below in order to copy its contents into a spreadsheet.) Historical Annual Volatilities and Correlations for Selected Stocks (based on monthly returns, 1996-2014) Southwest Ford Motor 60% General Kellogg Mills 17% Microsoft HP Inc. Alaska Air Airlines 33% 20% Volatility (Standard Deviation) Correlation with Microsoft HP Inc Alaska Air Southwest Airlines Ford Motor Kellogg General Mills 37% 37% 31% 1.00 0.39 0.21 0.24 0.27 0.05 0.08 0.39 1.00 0.28 0.35 0.27 0.11 0.06 0.24 0.35 0.39 1.00 0.30 0.15 0.22 0.27 0.27 0.15 0.30 1.00 0.18 0.06 0.05 0.11 0.15 0.15 0.18 1.00 0.54 0.08 0.06 0.20 0.22 0.06 0.54 1.00 0.21 0.28 1.00 0.39 0.15 0.15 0.20 Aluminum maker Alcoa has a beta of about 1.94, whereas Hormel Foods has a beta of 0.71. If the expected excess return of the market portfolio is 5%, which of these firms has a higher equity cost of capital, and how much higher is it? The firm that has the higher equity cost of capital is %. (Select from the drop-down menu and round to two decimal places.) by