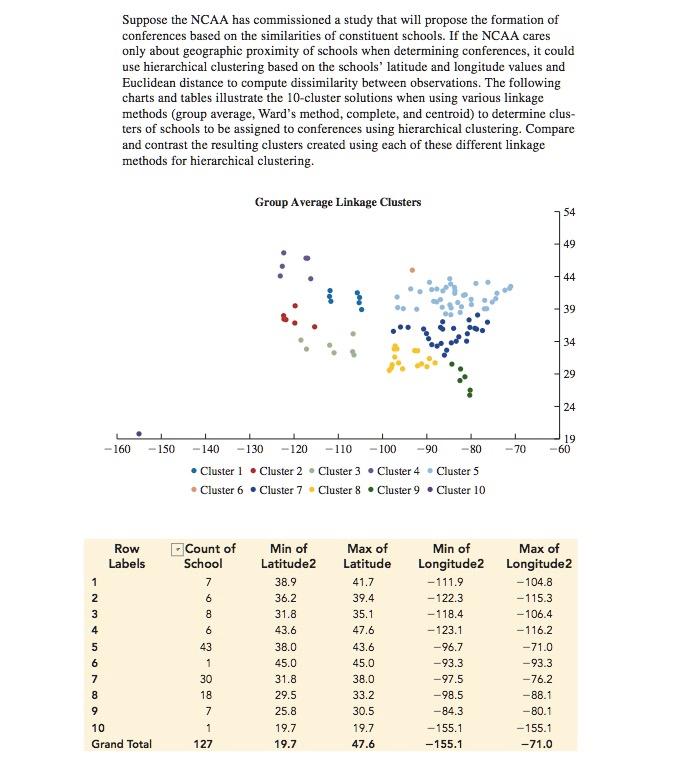
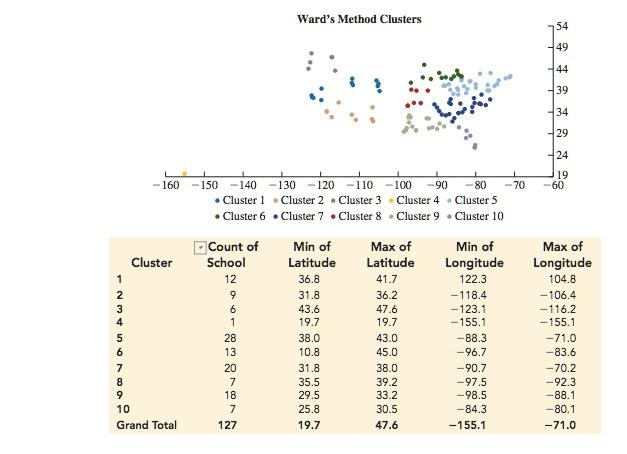
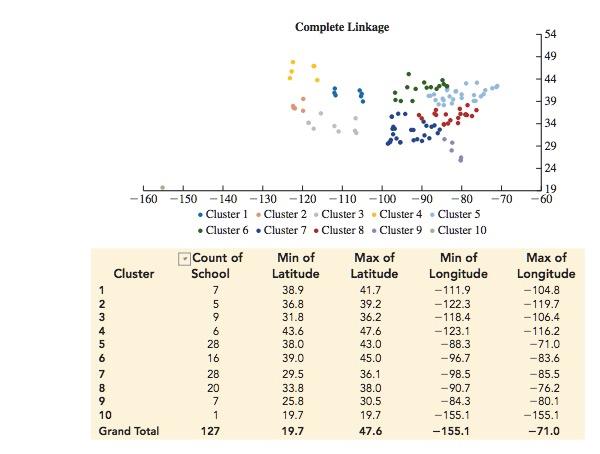
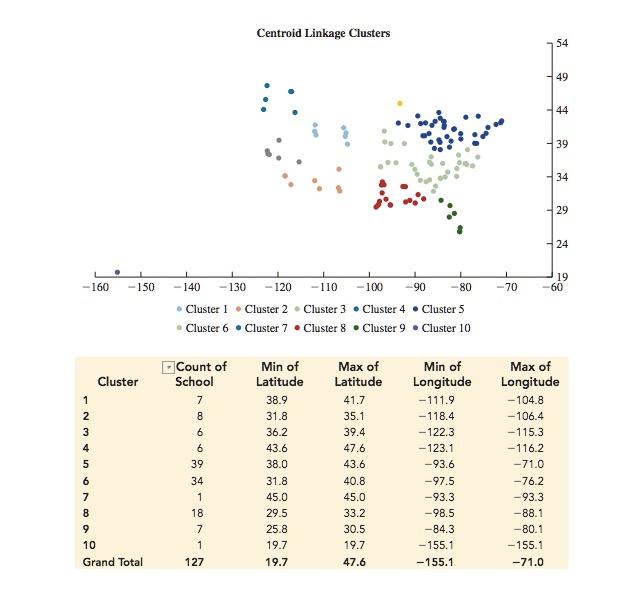
Suppose the NCAA has commissioned a study that will propose the formation of conferences based on the similarities of constituent schools. If the NCAA cares only about geographic proximity of schools when determining conferences, it could use hierarchical clustering based on the schools' latitude and longitude values and Euclidean distance to compute dissimilarity between observations. The following charts and tables illustrate the 10-cluster solutions when using various linkage methods (group average, Ward's method, complete, and centroid) to determine clus- ters of schools to be assigned to conferences using hierarchical clustering. Compare and contrast the resulting clusters created using each of these different linkage methods for hierarchical clustering. Group Average Linkage Clusters 54 -49 44 39 34 29 24 -160 - 150 -70 19 60 - 140 -130 -120 -110 -100 -90 -80 Cluster 1 Cluster 2 Cluster 3 Cluster 4 Cluster 5 Cluster 6. Cluster 7 Cluster 8 Cluster 9 Cluster 10 Row Labels Count of School 7 1 2 6 8 4 5 6 7 8 6 43 1 30 18 7 1 127 Min of Latitude2 38.9 36.2 31.8 43.6 38.0 45.0 31.8 29.5 25.8 19.7 19.7 Max of Latitude 41.7 39.4 35.1 47.6 43.6 45.0 38.0 33.2 30.5 19.7 47.6 Min of Max of Longitude2 Longitude 2 - 111.9 -104.8 - 122.3 -115.3 -- 118.4 -106.4 -123.1 -116.2 -96.7 -71.0 -93.3 -93.3 -97.5 -76.2 -98.5 -88.1 -84.3 --80.1 -155.1 -155.1 -155.1 -71.0 9 10 Grand Total Ward's Method Clusters 54 449 44 39 34 29 24 19 -60 L - 160 Cluster 1 2 3 4 5 6 7 8 9 10 Grand Total -150-140 -130 - 120 -110 -100-90 -80 -70 Cluster 1 Cluster 2 Cluster 3 Cluster 4 Cluster 5 Cluster 6. Cluster 7 Cluster 8 Cluster 9 Cluster 10 Count of Min of Max of Min of School Latitude Latitude Longitude 12 36.8 41.7 122.3 9 31.8 36.2 -118.4 6 43.6 47.6 -123.1 1 19.7 19.7 -155.1 28 38.0 43.0 - 88.3 13 10.8 45.0 -96.7 20 31.8 38.0 -90.7 7 35.5 39.2 -97.5 18 33.2 -98.5 7 25.8 30.5 -84.3 127 19.7 47.6 -155.1 Max of Longitude 104.8 -106.4 -116.2 -155.1 -71.0 -83.6 -70.2 -92.3 -88.1 -80.1 -71.0 29.5 Complete Linkage 54 49 44 39 34 29 24 - 160 19 -60 Cluster 1 2 3 4 5 6 7 8 9 10 Grand Total -150 - 140 - 130 -120 -110 -100 -90 -80 -70 Cluster 1 Cluster 2 Cluster 3 Cluster 4 Cluster 5 Cluster 6. Cluster 7 Cluster 8 Cluster 9 Cluster 10 Count of Min of Max of Min of School Latitude Latitude Longitude 7 38.9 41.7 -111.9 5 36.8 39.2 -122.3 9 31.8 36.2 -118.4 6 43.6 47.6 -123.1 28 38.0 43.0 -88.3 16 39.0 45.0 -96.7 28 29.5 36.1 -98.5 20 33.8 38.0 -90.7 7 25.8 30.5 -84.3 1 19.7 19.7 --155.1 127 19.7 47.6 -155.1 Max of Longitude -104.8 -119.7 -106.4 -116.2 - 71.0 -83.6 -85.5 -76.2 -80.1 -155.1 -71.0 Centroid Linkage Clusters 54 49 44 39 34 T 29 24 -160 -150 -70 19 60 - 140 -130 - 120 -110 -100 -90 -80 Cluster 1 Cluster 2 Cluster 3 Cluster 4 Cluster 5 Cluster 6. Cluster 7 Cluster 8 Cluster 9 Cluster 10 Cluster 1 2 3 4 5 6 7 8 9 10 Grand Total Count of School 7 8 6 6 39 34 Min of Latitude 38.9 31.8 36.2 43.6 38.0 31.8 45.0 29.5 25.8 19.7 19.7 Max of Latitude 41.7 35.1 39.4 47.6 43.6 40.8 45.0 33.2 30.5 19.7 Min of Longitude -111.9 -118.4 -122.3 -123.1 -93.6 - 97.5 --93.3 --98.5 -84.3 -155.1 -155.1 Max of Longitude - 104.8 -106.4 -115.3 -116.2 -71.0 - 76.2 -93.3 -88.1 - 80.1 -155.1 -71.0 1 18 7 1 127 47.6 Suppose the NCAA has commissioned a study that will propose the formation of conferences based on the similarities of constituent schools. If the NCAA cares only about geographic proximity of schools when determining conferences, it could use hierarchical clustering based on the schools' latitude and longitude values and Euclidean distance to compute dissimilarity between observations. The following charts and tables illustrate the 10-cluster solutions when using various linkage methods (group average, Ward's method, complete, and centroid) to determine clus- ters of schools to be assigned to conferences using hierarchical clustering. Compare and contrast the resulting clusters created using each of these different linkage methods for hierarchical clustering. Group Average Linkage Clusters 54 -49 44 39 34 29 24 -160 - 150 -70 19 60 - 140 -130 -120 -110 -100 -90 -80 Cluster 1 Cluster 2 Cluster 3 Cluster 4 Cluster 5 Cluster 6. Cluster 7 Cluster 8 Cluster 9 Cluster 10 Row Labels Count of School 7 1 2 6 8 4 5 6 7 8 6 43 1 30 18 7 1 127 Min of Latitude2 38.9 36.2 31.8 43.6 38.0 45.0 31.8 29.5 25.8 19.7 19.7 Max of Latitude 41.7 39.4 35.1 47.6 43.6 45.0 38.0 33.2 30.5 19.7 47.6 Min of Max of Longitude2 Longitude 2 - 111.9 -104.8 - 122.3 -115.3 -- 118.4 -106.4 -123.1 -116.2 -96.7 -71.0 -93.3 -93.3 -97.5 -76.2 -98.5 -88.1 -84.3 --80.1 -155.1 -155.1 -155.1 -71.0 9 10 Grand Total Ward's Method Clusters 54 449 44 39 34 29 24 19 -60 L - 160 Cluster 1 2 3 4 5 6 7 8 9 10 Grand Total -150-140 -130 - 120 -110 -100-90 -80 -70 Cluster 1 Cluster 2 Cluster 3 Cluster 4 Cluster 5 Cluster 6. Cluster 7 Cluster 8 Cluster 9 Cluster 10 Count of Min of Max of Min of School Latitude Latitude Longitude 12 36.8 41.7 122.3 9 31.8 36.2 -118.4 6 43.6 47.6 -123.1 1 19.7 19.7 -155.1 28 38.0 43.0 - 88.3 13 10.8 45.0 -96.7 20 31.8 38.0 -90.7 7 35.5 39.2 -97.5 18 33.2 -98.5 7 25.8 30.5 -84.3 127 19.7 47.6 -155.1 Max of Longitude 104.8 -106.4 -116.2 -155.1 -71.0 -83.6 -70.2 -92.3 -88.1 -80.1 -71.0 29.5 Complete Linkage 54 49 44 39 34 29 24 - 160 19 -60 Cluster 1 2 3 4 5 6 7 8 9 10 Grand Total -150 - 140 - 130 -120 -110 -100 -90 -80 -70 Cluster 1 Cluster 2 Cluster 3 Cluster 4 Cluster 5 Cluster 6. Cluster 7 Cluster 8 Cluster 9 Cluster 10 Count of Min of Max of Min of School Latitude Latitude Longitude 7 38.9 41.7 -111.9 5 36.8 39.2 -122.3 9 31.8 36.2 -118.4 6 43.6 47.6 -123.1 28 38.0 43.0 -88.3 16 39.0 45.0 -96.7 28 29.5 36.1 -98.5 20 33.8 38.0 -90.7 7 25.8 30.5 -84.3 1 19.7 19.7 --155.1 127 19.7 47.6 -155.1 Max of Longitude -104.8 -119.7 -106.4 -116.2 - 71.0 -83.6 -85.5 -76.2 -80.1 -155.1 -71.0 Centroid Linkage Clusters 54 49 44 39 34 T 29 24 -160 -150 -70 19 60 - 140 -130 - 120 -110 -100 -90 -80 Cluster 1 Cluster 2 Cluster 3 Cluster 4 Cluster 5 Cluster 6. Cluster 7 Cluster 8 Cluster 9 Cluster 10 Cluster 1 2 3 4 5 6 7 8 9 10 Grand Total Count of School 7 8 6 6 39 34 Min of Latitude 38.9 31.8 36.2 43.6 38.0 31.8 45.0 29.5 25.8 19.7 19.7 Max of Latitude 41.7 35.1 39.4 47.6 43.6 40.8 45.0 33.2 30.5 19.7 Min of Longitude -111.9 -118.4 -122.3 -123.1 -93.6 - 97.5 --93.3 --98.5 -84.3 -155.1 -155.1 Max of Longitude - 104.8 -106.4 -115.3 -116.2 -71.0 - 76.2 -93.3 -88.1 - 80.1 -155.1 -71.0 1 18 7 1 127 47.6