Suppose UST takes out a $1 billion loan.
-
Prepare a statement analyzing whether UST will be able to make the P&I (principal & interest) payments
-
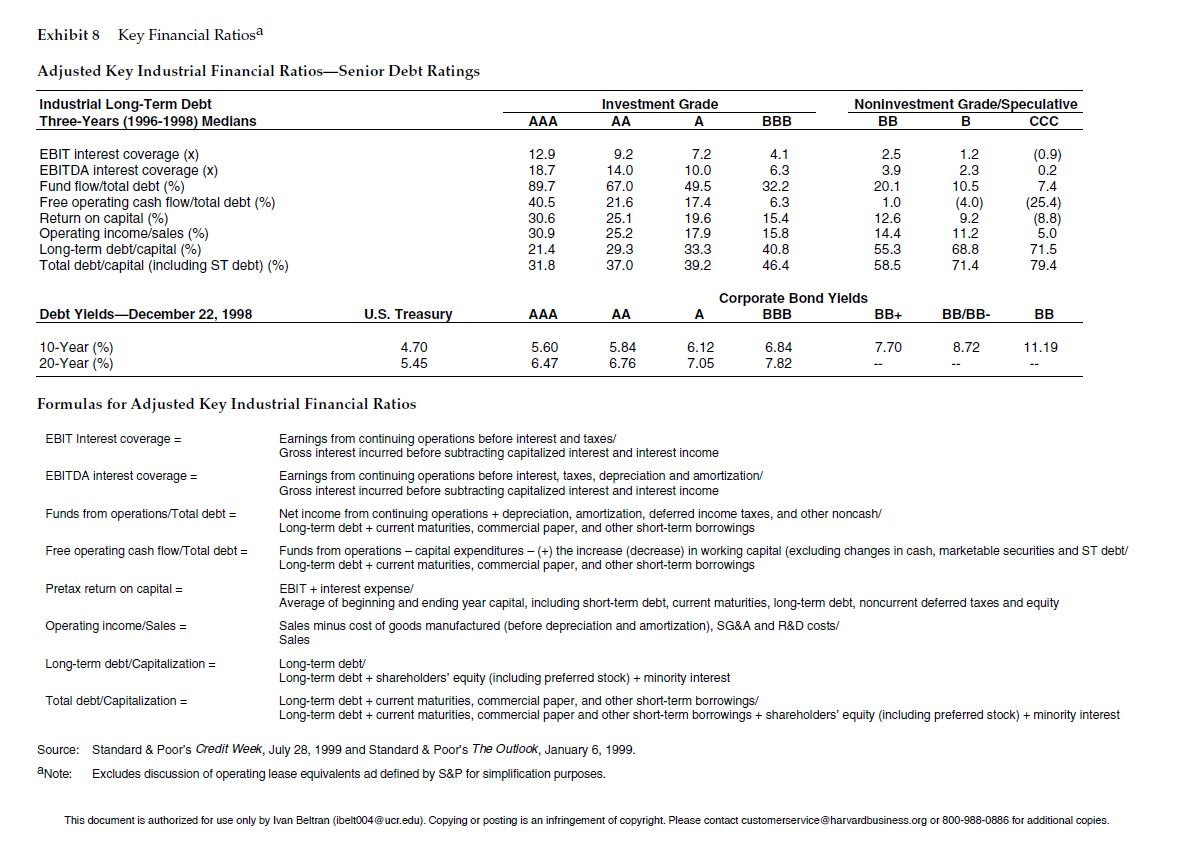
Use Exhibit 8 to determine USTs credit rating and interest rate and your (dis)approval of the loan. State your assumptions clearly.
Exhibit 8 Key Financial Ratiosa Adjusted Key Industrial Financial RatiosSenior Debt Ratings Industrial Long-Term Debt Three-Years (1996-1998) Medians Investment Grade A Noninvestment Grade/Speculative BB B CCC AAA BBB EBIT interest coverage (x) EBITDA interest coverage (x) Fund flow/total debt (%) Free operating cash flow/total debt (%) Return on capital (%) Operating income sales (%) Long-term debt/capital (%) Total debt/capital (including ST debt) (%) 12.9 18.7 89.7 40.5 30.6 30.9 21.4 31.8 9.2 14.0 67.0 21.6 25.1 25.2 29.3 37.0 7.2 10.0 49.5 17.4 19.6 17.9 33.3 4.1 6.3 32.2 6.3 15.4 15.8 40.8 46.4 2.5 3.9 20.1 1.0 12.6 14.4 55.3 58.5 1.2 2.3 10.5 (4.0) 9.2 (0.9) 0.2 7.4 (25.4) (8.8) 5.0 71.5 79.4 11.2 68.8 71.4 39.2 Debt Yields-December 22, 1998 U.S. Treasury AAA AA Corporate Bond Yields BBB BB+ A BB/BB- BB 7.70 8.72 11.19 10-Year (%) 20-Year (%) 4.70 5.45 5.60 6.47 5.84 6.76 6.12 7.05 6.84 7.82 Formulas for Adjusted Key Industrial Financial Ratios EBIT Interest coverage = EBITDA interest coverage = Funds from operations/Total debt = Free operating cash flow/Total debt = Earnings from continuing operations before interest and taxes/ Gross interest incurred before subtracting capitalized interest and interest income Earnings from continuing operations before interest, taxes, depreciation and amortization/ Gross interest incurred before subtracting capitalized interest and interest income Net income from continuing operations + depreciation, amortization, deferred income taxes, and other noncash/ Long-term debt + current maturities, commercial paper, and other short-term borrowings Funds from operations - capital expenditures - (+) the increase (decrease) in working capital (excluding changes in cash, marketable securities and ST debt/ Long-term debt + current maturities, commercial paper, and other short-term borrowings EBIT + interest expense/ Average of beginning and ending year capital, including short-term debt, current maturities, long-term debt, noncurrent deferred taxes and equity Sales minus cost of goods manufactured before depreciation and amortization), SG&A and R&D costs/ Sales Long-term debt Long-term debt shareholders' equity (including preferred stock) + minority interest Long-term debt + current maturities, commercial paper, and other short-term borrowings/ Long-term debt + current maturities, commercial paper and other short-term borrowings + shareholders' equity (including preferred stock) + minority interest Pretax return on capital = Operating income/Sales = Long-term debt/Capitalization = Total debt/Capitalization = Source: Standard & Poor's Credit Week, July 28, 1999 and Standard & Poor's The Outlook, January 6, 1999. a Note: Excludes discussion of operating lease equivalents ad defined by S&P for simplification purposes. This document is authorized for use only by Ivan Beltran (ibelt004@ucr.edu). Copying or posting is an infringement of copyright. Please contact customerservice@harvardbusiness.org or 800-988-0886 for additional copies. Exhibit 8 Key Financial Ratiosa Adjusted Key Industrial Financial RatiosSenior Debt Ratings Industrial Long-Term Debt Three-Years (1996-1998) Medians Investment Grade A Noninvestment Grade/Speculative BB B CCC AAA BBB EBIT interest coverage (x) EBITDA interest coverage (x) Fund flow/total debt (%) Free operating cash flow/total debt (%) Return on capital (%) Operating income sales (%) Long-term debt/capital (%) Total debt/capital (including ST debt) (%) 12.9 18.7 89.7 40.5 30.6 30.9 21.4 31.8 9.2 14.0 67.0 21.6 25.1 25.2 29.3 37.0 7.2 10.0 49.5 17.4 19.6 17.9 33.3 4.1 6.3 32.2 6.3 15.4 15.8 40.8 46.4 2.5 3.9 20.1 1.0 12.6 14.4 55.3 58.5 1.2 2.3 10.5 (4.0) 9.2 (0.9) 0.2 7.4 (25.4) (8.8) 5.0 71.5 79.4 11.2 68.8 71.4 39.2 Debt Yields-December 22, 1998 U.S. Treasury AAA AA Corporate Bond Yields BBB BB+ A BB/BB- BB 7.70 8.72 11.19 10-Year (%) 20-Year (%) 4.70 5.45 5.60 6.47 5.84 6.76 6.12 7.05 6.84 7.82 Formulas for Adjusted Key Industrial Financial Ratios EBIT Interest coverage = EBITDA interest coverage = Funds from operations/Total debt = Free operating cash flow/Total debt = Earnings from continuing operations before interest and taxes/ Gross interest incurred before subtracting capitalized interest and interest income Earnings from continuing operations before interest, taxes, depreciation and amortization/ Gross interest incurred before subtracting capitalized interest and interest income Net income from continuing operations + depreciation, amortization, deferred income taxes, and other noncash/ Long-term debt + current maturities, commercial paper, and other short-term borrowings Funds from operations - capital expenditures - (+) the increase (decrease) in working capital (excluding changes in cash, marketable securities and ST debt/ Long-term debt + current maturities, commercial paper, and other short-term borrowings EBIT + interest expense/ Average of beginning and ending year capital, including short-term debt, current maturities, long-term debt, noncurrent deferred taxes and equity Sales minus cost of goods manufactured before depreciation and amortization), SG&A and R&D costs/ Sales Long-term debt Long-term debt shareholders' equity (including preferred stock) + minority interest Long-term debt + current maturities, commercial paper, and other short-term borrowings/ Long-term debt + current maturities, commercial paper and other short-term borrowings + shareholders' equity (including preferred stock) + minority interest Pretax return on capital = Operating income/Sales = Long-term debt/Capitalization = Total debt/Capitalization = Source: Standard & Poor's Credit Week, July 28, 1999 and Standard & Poor's The Outlook, January 6, 1999. a Note: Excludes discussion of operating lease equivalents ad defined by S&P for simplification purposes. This document is authorized for use only by Ivan Beltran (ibelt004@ucr.edu). Copying or posting is an infringement of copyright. Please contact customerservice@harvardbusiness.org or 800-988-0886 for additional copies


