Answered step by step
Verified Expert Solution
Question
1 Approved Answer
Suppose you are a risk analyst working for M&T Bank and you are asked to estimate potential operational risk losses for a particular risk

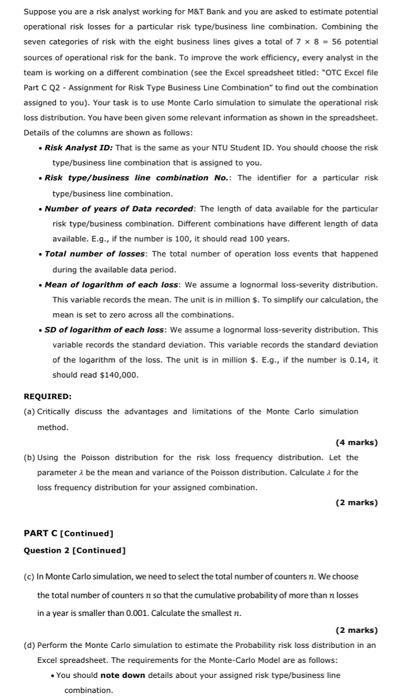
Suppose you are a risk analyst working for M&T Bank and you are asked to estimate potential operational risk losses for a particular risk type/business line combination. Combining the seven categories of risk with the eight business lines gives a total of 7 x 8 - 56 potential sources of operational risk for the bank. To improve the work efficiency, every analyst in the team is working on a different combination (see the Excel spreadsheet titled: "OTC Excel file Part C Q2 - Assignment for Risk Type Business Line Combination" to find out the combination assigned to you). Your task is to use Monte Carlo simulation to simulate the operational risk loss distribution. You have been given some relevant information as shown in the spreadsheet. Details of the columns are shown as follows: Risk Analyst ID: That is the same as your NTU Student ID. You should choose the risk type/business line combination that is assigned to you. Risk type/business line combination No.: The identifier for a particular risk type/business line combination. Number of years of Data recorded: The length of data available for the particular risk type/business combination. Different combinations have different length of data available. E.g., if the number is 100, it should read 100 years. Total number of losses: The total number of operation loss events that happened during the available data period. . Mean of logarithm of each loss: We assume a lognormal loss-severity distribution. This variable records the mean. The unit is in million $. To simplify our calculation, the mean is set to zero across all the combinations. .SD of logarithm of each loss: We assume a lognormal loss-severity distribution. This variable records the standard deviation. This variable records the standard deviation of the logarithm of the loss. The unit is in million $. E.g., if the number is 0.14, it should read $140,000. REQUIRED: (a) Critically discuss the advantages and limitations of the Monte Carlo simulation method. (4 marks) (b) Using the Poisson distribution for the risk loss frequency distribution. Let the parameter 2 be the mean and variance of the Poisson distribution. Calculate for the loss frequency distribution for your assigned combination. (2 marks) PART C [Continued] Question 2 [Continued] (c) In Monte Carlo simulation, we need to select the total number of counters . We choose the total number of counters it so that the cumulative probability of more than losses in a year is smaller than 0.001. Calculate the smallest n. (2 marks) (d) Perform the Monte Carlo simulation to estimate the Probability risk loss distribution in an Excel spreadsheet. The requirements for the Monte-Carlo Model are as follows: You should note down details about your assigned risk type/business line combination.
Step by Step Solution
There are 3 Steps involved in it
Step: 1

Get Instant Access to Expert-Tailored Solutions
See step-by-step solutions with expert insights and AI powered tools for academic success
Step: 2

Step: 3

Ace Your Homework with AI
Get the answers you need in no time with our AI-driven, step-by-step assistance
Get Started


