

Answered step by step
Verified Expert Solution
Question
1 Approved Answer
Suppose you are an investment analyst who has been asked to review the valuations of the 30 Malaysian professional football clubs (MFC). You seek to
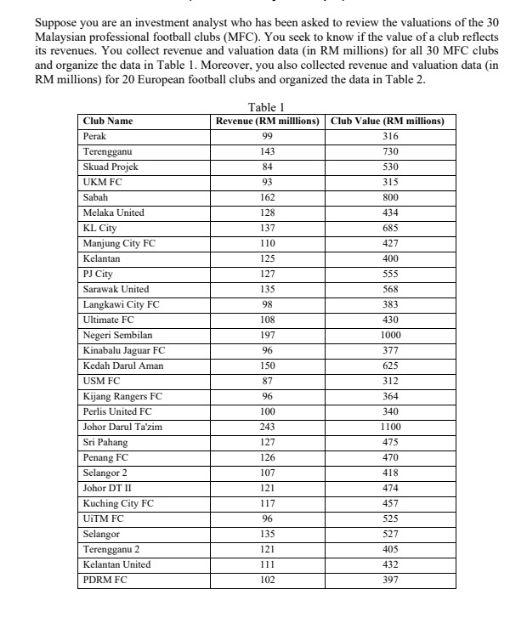
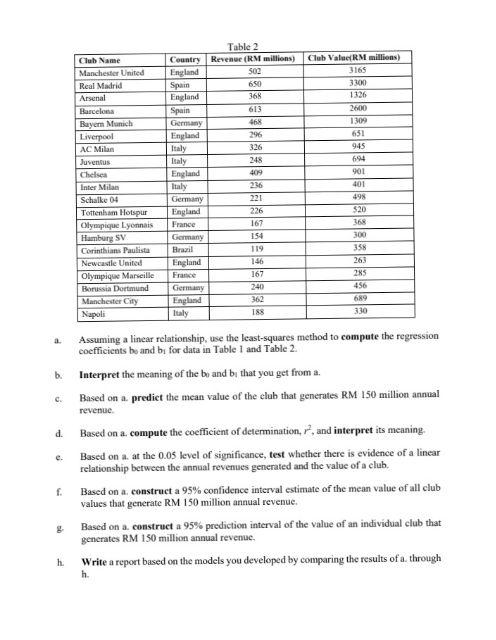
Suppose you are an investment analyst who has been asked to review the valuations of the 30 Malaysian professional football clubs (MFC). You seek to know if the value of a club reflects its revenues. You collect revenue and valuation data (in RM millions) for all 30 MFC clubs and organize the data in Table 1. Moreover, you also collected revenue and valuation data (in RM millions) for 20 European football clubs and organized the data in Table 2. Club Name Perak Terengganu Skuad Projek UKM FC Sabah Melaka United KL City Manjung City FC Kelantan PJ City Sarawak United Langkawi City FC Ultimate FC Negeri Sembilan Kinabalu Jaguar FC Kedah Darul Aman USM FC Kijang Rangers FC Perlis United FC Johor Darul Ta'zim Sri Pahang Penang FC Selangor 2 Johor DT II Kuching City FC UiTM FC Selangor Terengganu 2 Kelantan United PDRM FC Table 1 Revenue (RM milllions) Club Value (RM millions) 99 316 730 530 315 143 84 93 162 128 137 110 125 127 135 98 108 197 96 150 87 96 100 243 127 126 107 121 117 96 135 121 111 102 800 434 685 427 400 555 568 383 430 1000 377 625 312 364 340 1100 475 470 418 474 457 525 527 405 432 397 a. b. C. d. e. f. g h. Club Name Manchester United Real Madrid Arsenal Barcelona Bayern Munich Liverpool AC Milan Juventus Chelsea Inter Milan Schalke 04 Tottenham Hotspur Olympique Lyonnais Hamburg SV Corinthians Paulista Newcastle United Olympique Marseille Borussia Dortmund Manchester City Napoli Table 2 Country Revenue (RM millions) England 502 Spain England Spain Germany England Italy Italy England Italy Germany England France Germany Brazil England France Germany England Italy 650 368 613 468 296 326 248 409 236 221 226 167 154 119 146 167 240 362 188 Club Value(RM millions) 3165 3300 1326 2600 1309 651 945 694 901 401 498 520 368 300 358 263 285 456 689 330 Assuming a linear relationship, use the least-squares method to compute the regression coefficients be and by for data in Table 1 and Table 2. Interpret the meaning of the be and be that you get from a. Based on a predict the mean value of the club that generates RM 150 million annual revenue. Based on a compute the coefficient of determination, 2, and interpret its meaning. Based on a. at the 0.05 level of significance, test whether there is evidence of a linear relationship between the annual revenues generated and the value of a club. Based on a construct a 95% confidence interval estimate of the mean value of all club values that generate RM 150 million annual revenue. Based on a construct a 95% prediction interval of the value of an individual club that generates RM 150 million annual revenue. Write a report based on the models you developed by comparing the results of a. through h. Suppose you are an investment analyst who has been asked to review the valuations of the 30 Malaysian professional football clubs (MFC). You seek to know if the value of a club reflects its revenues. You collect revenue and valuation data (in RM millions) for all 30 MFC clubs and organize the data in Table 1. Moreover, you also collected revenue and valuation data (in RM millions) for 20 European football clubs and organized the data in Table 2. Club Name Perak Terengganu Skuad Projek UKM FC Sabah Melaka United KL City Manjung City FC Kelantan PJ City Sarawak United Langkawi City FC Ultimate FC Negeri Sembilan Kinabalu Jaguar FC Kedah Darul Aman USM FC Kijang Rangers FC Perlis United FC Johor Darul Ta'zim Sri Pahang Penang FC Selangor 2 Johor DT II Kuching City FC UiTM FC Selangor Terengganu 2 Kelantan United PDRM FC Table 1 Revenue (RM milllions) Club Value (RM millions) 99 316 730 530 315 143 84 93 162 128 137 110 125 127 135 98 108 197 96 150 87 96 100 243 127 126 107 121 117 96 135 121 111 102 800 434 685 427 400 555 568 383 430 1000 377 625 312 364 340 1100 475 470 418 474 457 525 527 405 432 397 a. b. C. d. e. f. g h. Club Name Manchester United Real Madrid Arsenal Barcelona Bayern Munich Liverpool AC Milan Juventus Chelsea Inter Milan Schalke 04 Tottenham Hotspur Olympique Lyonnais Hamburg SV Corinthians Paulista Newcastle United Olympique Marseille Borussia Dortmund Manchester City Napoli Table 2 Country Revenue (RM millions) England 502 Spain England Spain Germany England Italy Italy England Italy Germany England France Germany Brazil England France Germany England Italy 650 368 613 468 296 326 248 409 236 221 226 167 154 119 146 167 240 362 188 Club Value(RM millions) 3165 3300 1326 2600 1309 651 945 694 901 401 498 520 368 300 358 263 285 456 689 330 Assuming a linear relationship, use the least-squares method to compute the regression coefficients be and by for data in Table 1 and Table 2. Interpret the meaning of the be and be that you get from a. Based on a predict the mean value of the club that generates RM 150 million annual revenue. Based on a compute the coefficient of determination, 2, and interpret its meaning. Based on a. at the 0.05 level of significance, test whether there is evidence of a linear relationship between the annual revenues generated and the value of a club. Based on a construct a 95% confidence interval estimate of the mean value of all club values that generate RM 150 million annual revenue. Based on a construct a 95% prediction interval of the value of an individual club that generates RM 150 million annual revenue. Write a report based on the models you developed by comparing the results of a. through h
Step by Step Solution
There are 3 Steps involved in it
Step: 1

Get Instant Access to Expert-Tailored Solutions
See step-by-step solutions with expert insights and AI powered tools for academic success
Step: 2

Step: 3
Ace Your Homework with AI
Get the answers you need in no time with our AI-driven, step-by-step assistance
Get Started
Finance And Modernization
Authors: Gerald D. Feldman, Peter Hertner
1st Edition
0754662713, 978-0754662716