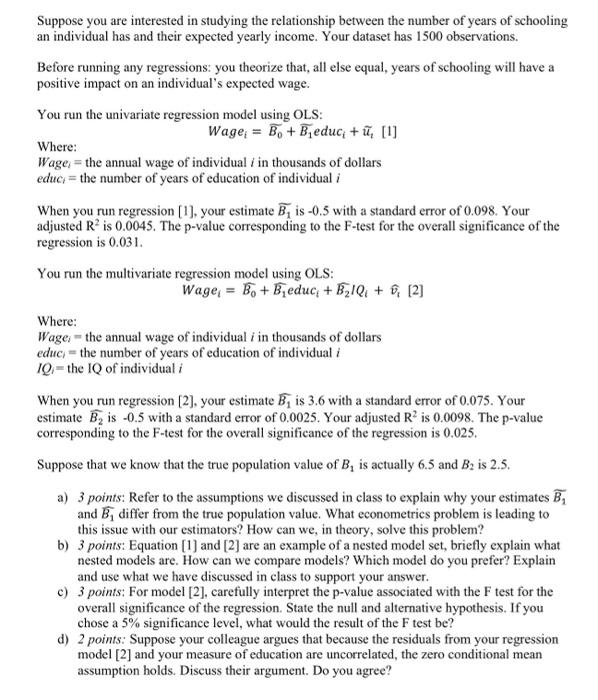
Suppose you are interested in studying the relationship between the number of years of schooling an individual has and their expected yearly income. Your dataset has 1500 observations. Before running any regressions: you theorize that, all else equal, years of schooling will have a positive impact on an individual's expected wage. You run the univariate regression model using OLS: Where: Wagei= the annual wage of individual i in thousands of dollars educi= the number of years of education of individual i When you run regression [1], your estimate B1 is 0.5 with a standard error of 0.098. Your adjusted R2 is 0.0045. The p-value corresponding to the F-test for the overall significance of the regression is 0.031. You run the multivariate regression model using OLS: Wiei=B0+B1educi+B2IQi+vi[2] Where: Wagei= the annual wage of individual i in thousands of dollars educi= the number of years of education of individual i IQi= the IQ of individual i When you run regression [2], your estimate B1 is 3.6 with a standard error of 0.075. Your estimate B2 is 0.5 with a standard error of 0.0025. Your adjusted R2 is 0.0098. The p-value corresponding to the F-test for the overall significance of the regression is 0.025. Suppose that we know that the true population value of B1 is actually 6.5 and B2 is 2.5. a) 3 points: Refer to the assumptions we discussed in class to explain why your estimates B1 and B1 differ from the true population value. What econometrics problem is leading to this issue with our estimators? How can we, in theory, solve this problem? b) 3 points: Equation [1] and [2] are an example of a nested model set, briefly explain what nested models are. How can we compare models? Which model do you prefer? Explain and use what we have discussed in class to support your answer. c) 3 points: For model [2], carefully interpret the p-value associated with the F test for the overall significance of the regression. State the null and alternative hypothesis. If you chose a 5% significance level, what would the result of the F test be? d) 2 points: Suppose your colleague argues that because the residuals from your regression model [2] and your measure of education are uncorrelated, the zero conditional mean assumption holds. Discuss their argument. Do you agree? Suppose you are interested in studying the relationship between the number of years of schooling an individual has and their expected yearly income. Your dataset has 1500 observations. Before running any regressions: you theorize that, all else equal, years of schooling will have a positive impact on an individual's expected wage. You run the univariate regression model using OLS: Where: Wagei= the annual wage of individual i in thousands of dollars educi= the number of years of education of individual i When you run regression [1], your estimate B1 is 0.5 with a standard error of 0.098. Your adjusted R2 is 0.0045. The p-value corresponding to the F-test for the overall significance of the regression is 0.031. You run the multivariate regression model using OLS: Wiei=B0+B1educi+B2IQi+vi[2] Where: Wagei= the annual wage of individual i in thousands of dollars educi= the number of years of education of individual i IQi= the IQ of individual i When you run regression [2], your estimate B1 is 3.6 with a standard error of 0.075. Your estimate B2 is 0.5 with a standard error of 0.0025. Your adjusted R2 is 0.0098. The p-value corresponding to the F-test for the overall significance of the regression is 0.025. Suppose that we know that the true population value of B1 is actually 6.5 and B2 is 2.5. a) 3 points: Refer to the assumptions we discussed in class to explain why your estimates B1 and B1 differ from the true population value. What econometrics problem is leading to this issue with our estimators? How can we, in theory, solve this problem? b) 3 points: Equation [1] and [2] are an example of a nested model set, briefly explain what nested models are. How can we compare models? Which model do you prefer? Explain and use what we have discussed in class to support your answer. c) 3 points: For model [2], carefully interpret the p-value associated with the F test for the overall significance of the regression. State the null and alternative hypothesis. If you chose a 5% significance level, what would the result of the F test be? d) 2 points: Suppose your colleague argues that because the residuals from your regression model [2] and your measure of education are uncorrelated, the zero conditional mean assumption holds. Discuss their argument. Do you agree


