Question
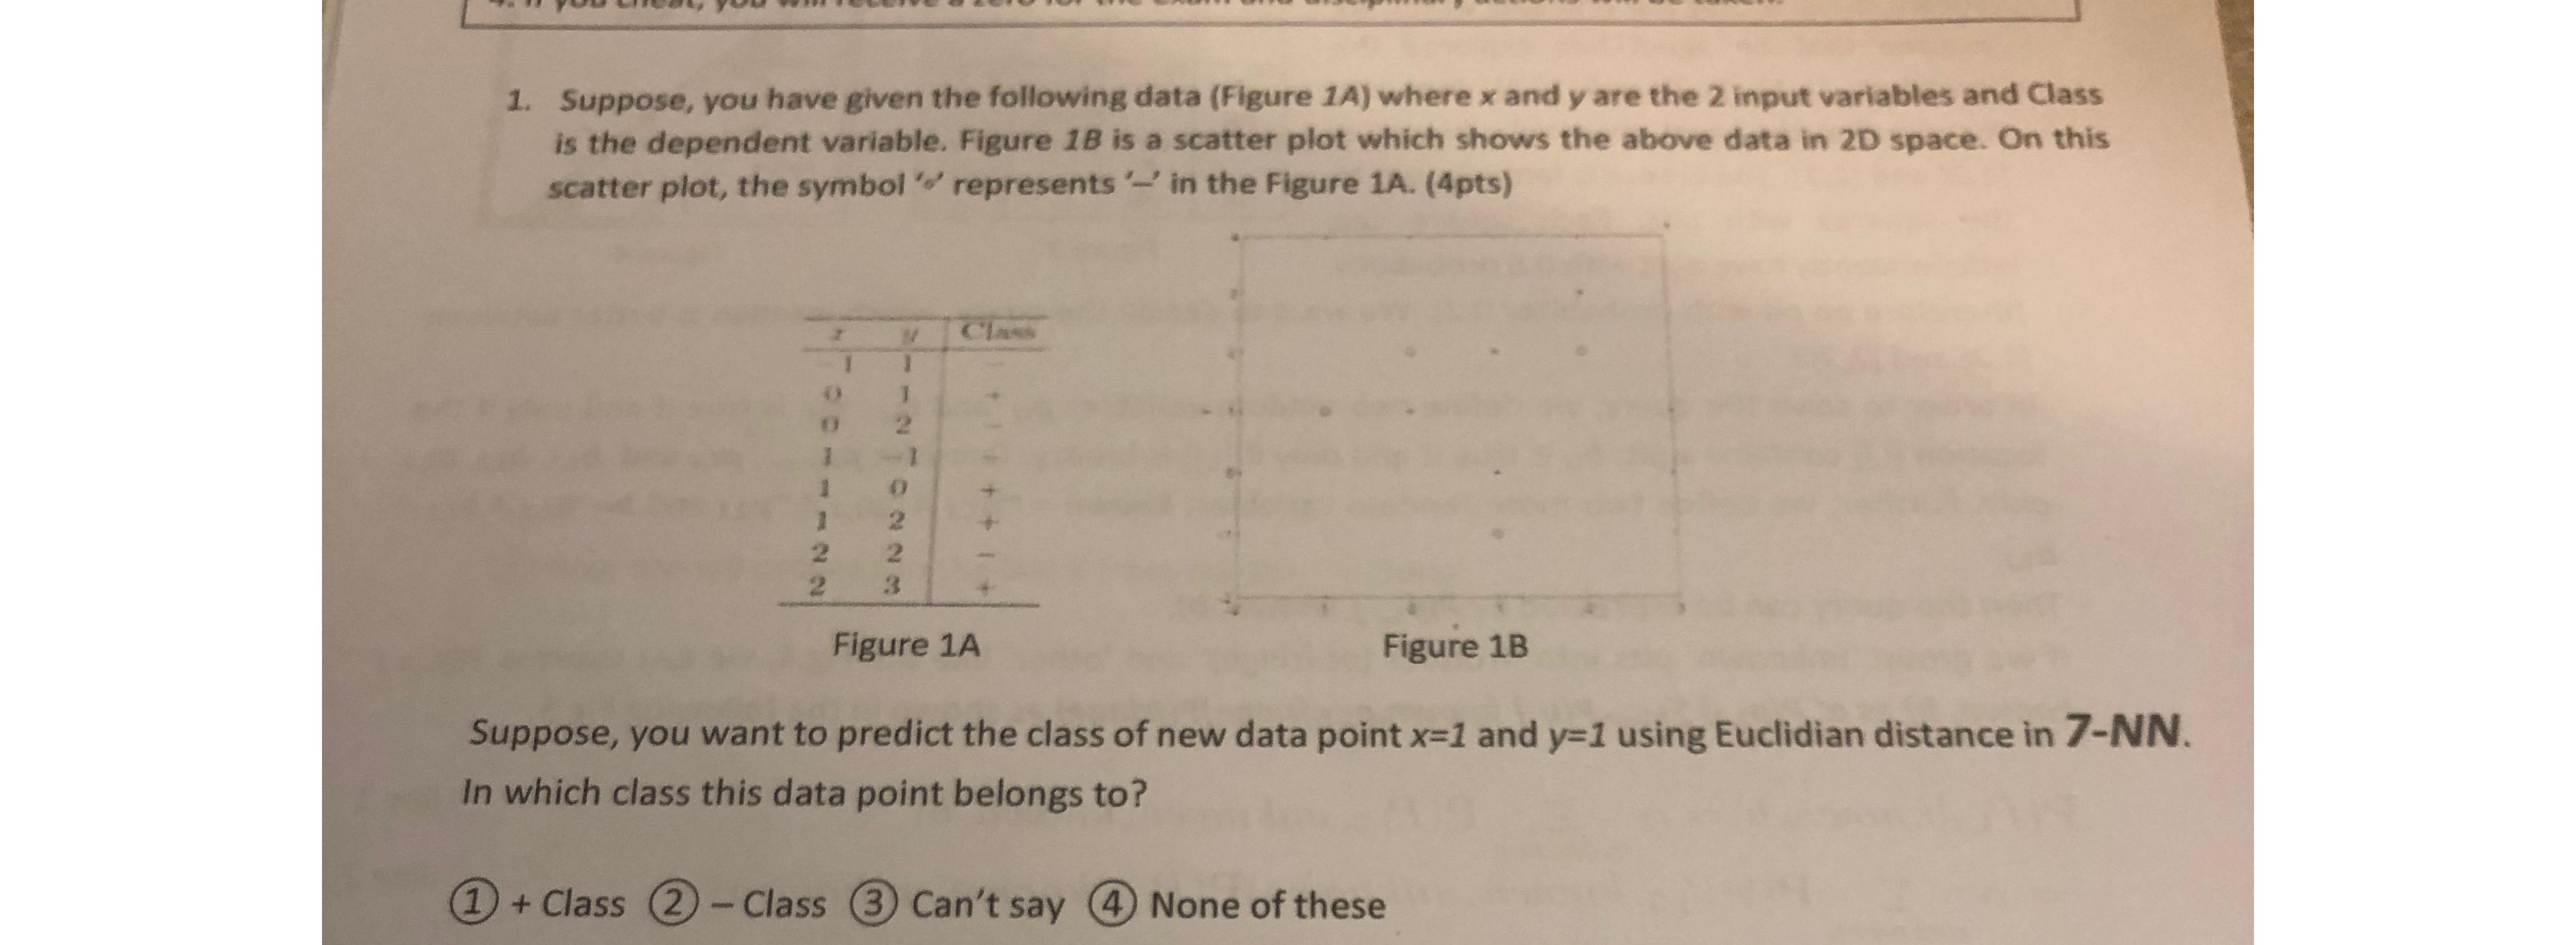
Suppose, you have given the following data (Figure 1A) where x and y are the 2 input variables and Class is the dependent variable. Figure
Suppose, you have given the following data (Figure 1A) where
xand
yare the 2 input variables and Class is the dependent variable. Figure 18 is a scatter plot which shows the above data in 20 space. On this scatter plot, the symbol ' represents "- in the Figure 1A. (4pts)\ \\\\table[[
x,
y,Clas],[1,1,],[0,1,+],[0,2,],[1,1,-],[1,0,+],[1,2,+],[2,2,-],[2,3,+]]\ Figure
1A\ Suppose, you want to predict the class of new data point
x=1and
y=1using Euclidian distance in
7-N. In which class this data point belongs to?\ (1) + Class (2) - Class (3) Can't say (4) None of these

Step by Step Solution
There are 3 Steps involved in it
Step: 1

Get Instant Access to Expert-Tailored Solutions
See step-by-step solutions with expert insights and AI powered tools for academic success
Step: 2

Step: 3

Ace Your Homework with AI
Get the answers you need in no time with our AI-driven, step-by-step assistance
Get Started


