Answered step by step
Verified Expert Solution
Link Copied!

Question

1 Approved Answer

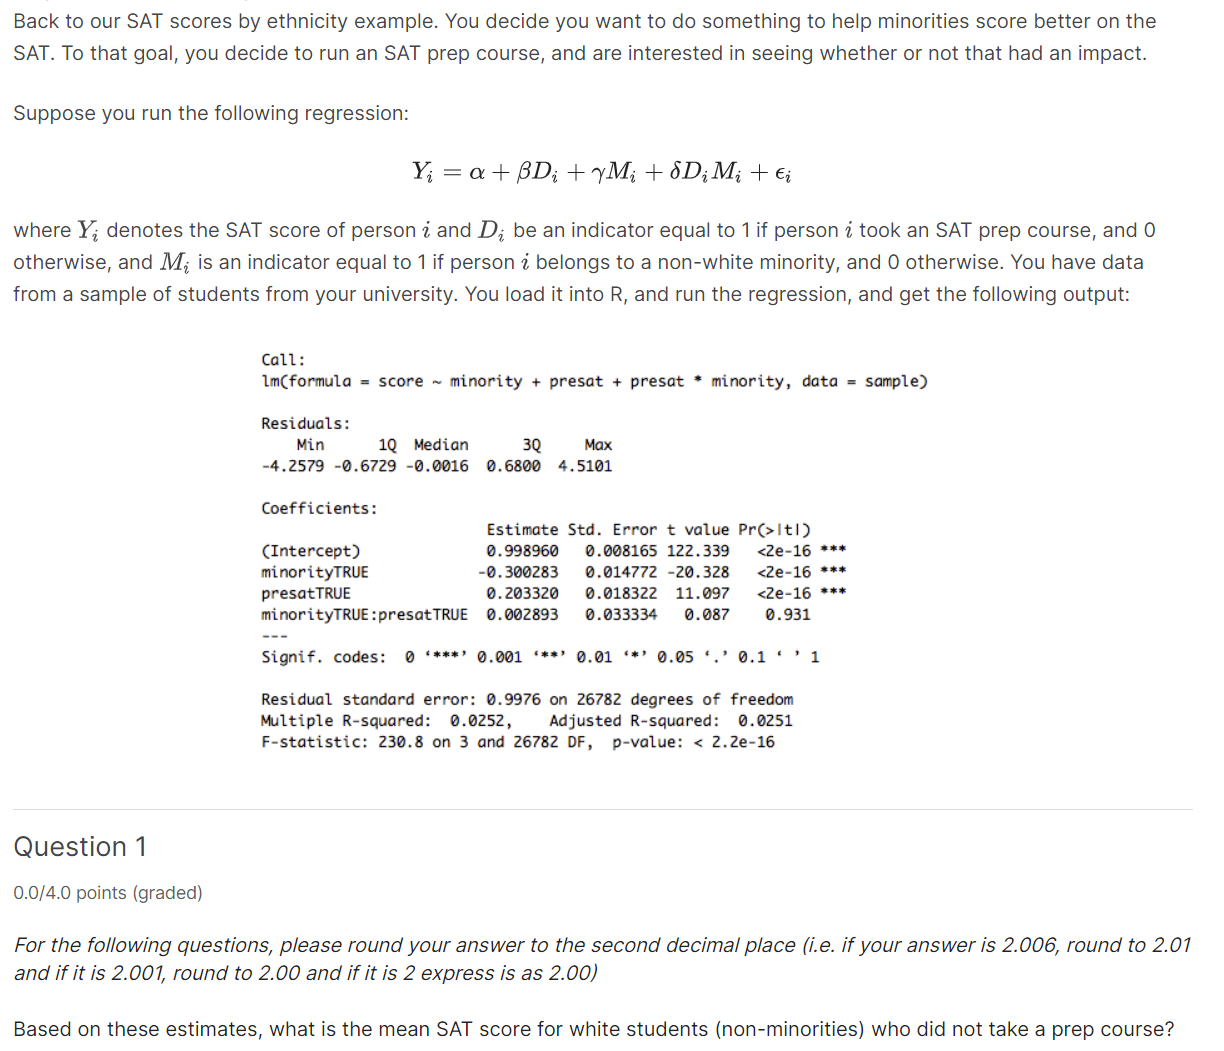
Suppose you run the following regression: Yi = a+ BMi+ ci where Y denotes the standardized SAT score of person i and M; be an
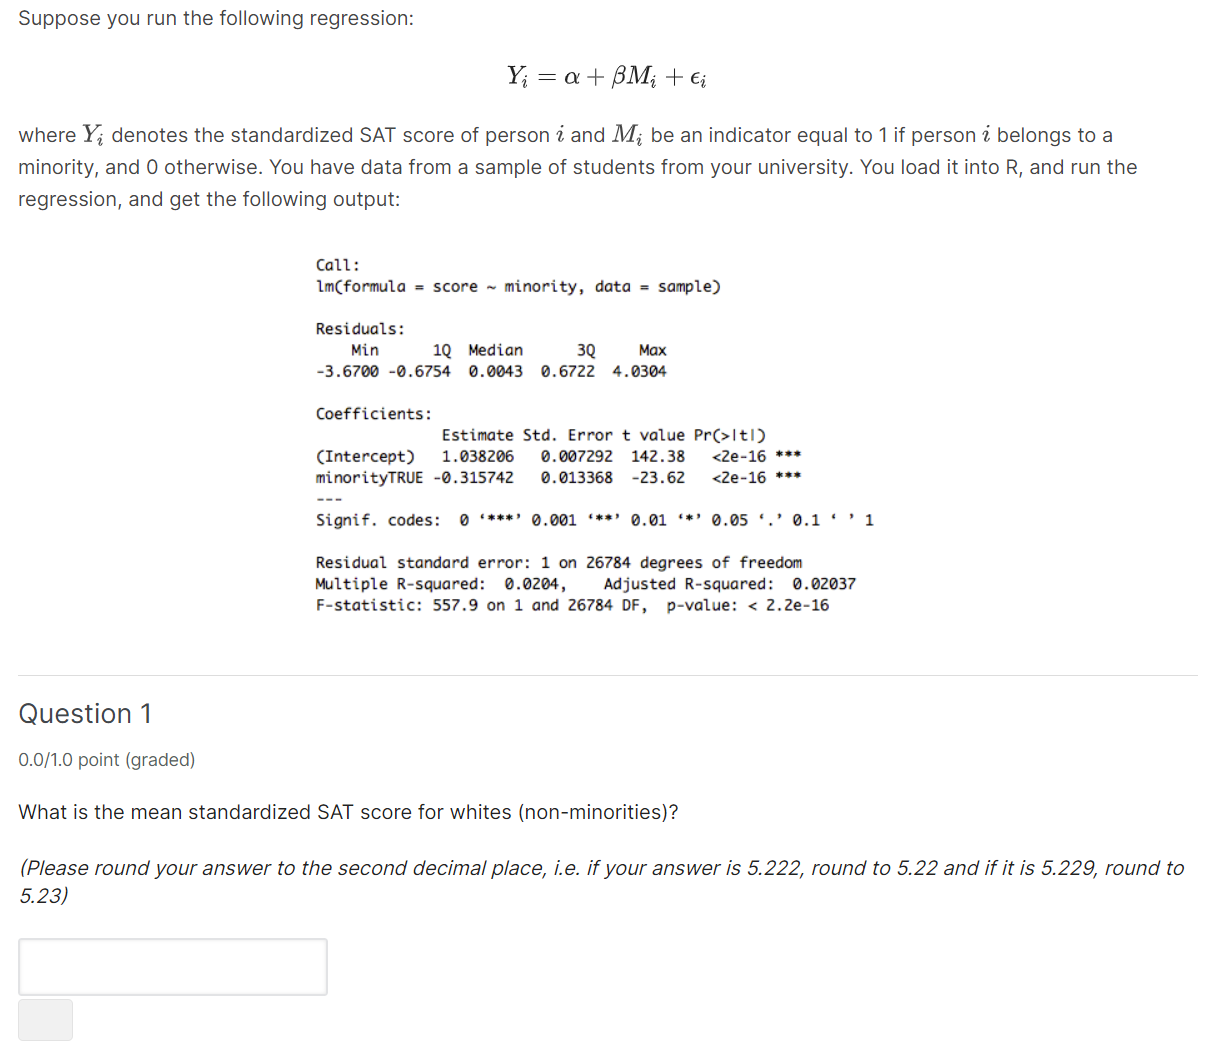
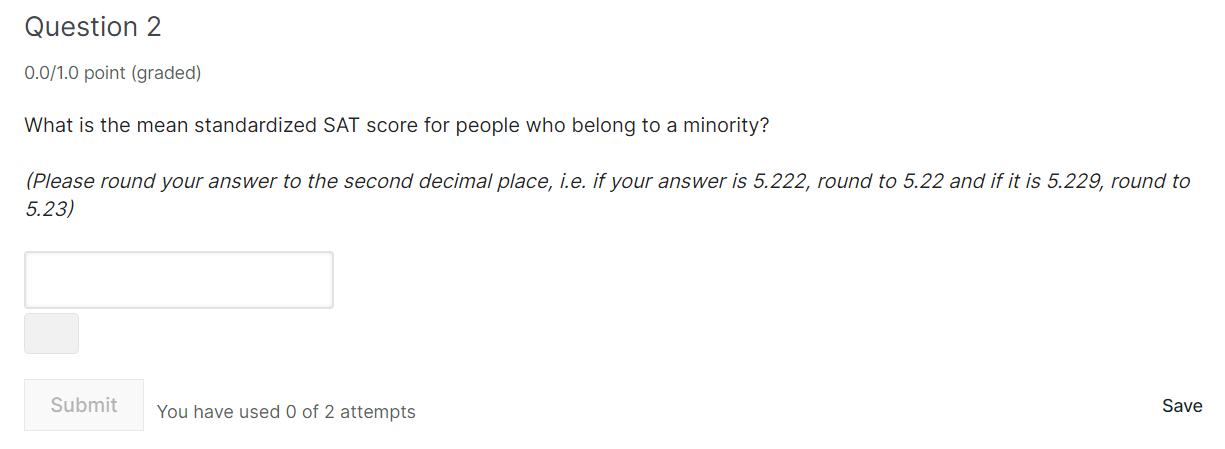
image text in transcribedimage text in transcribedimage text in transcribedimage text in transcribedimage text in transcribedimage text in transcribed
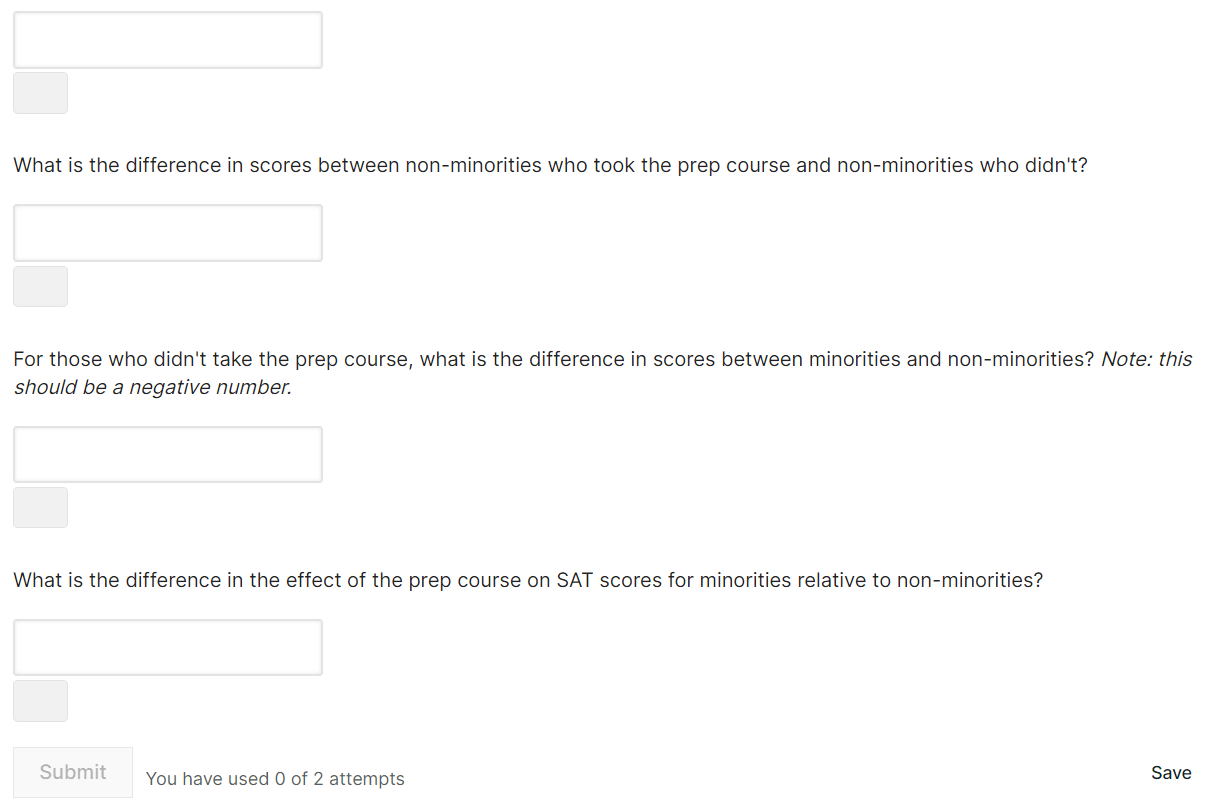
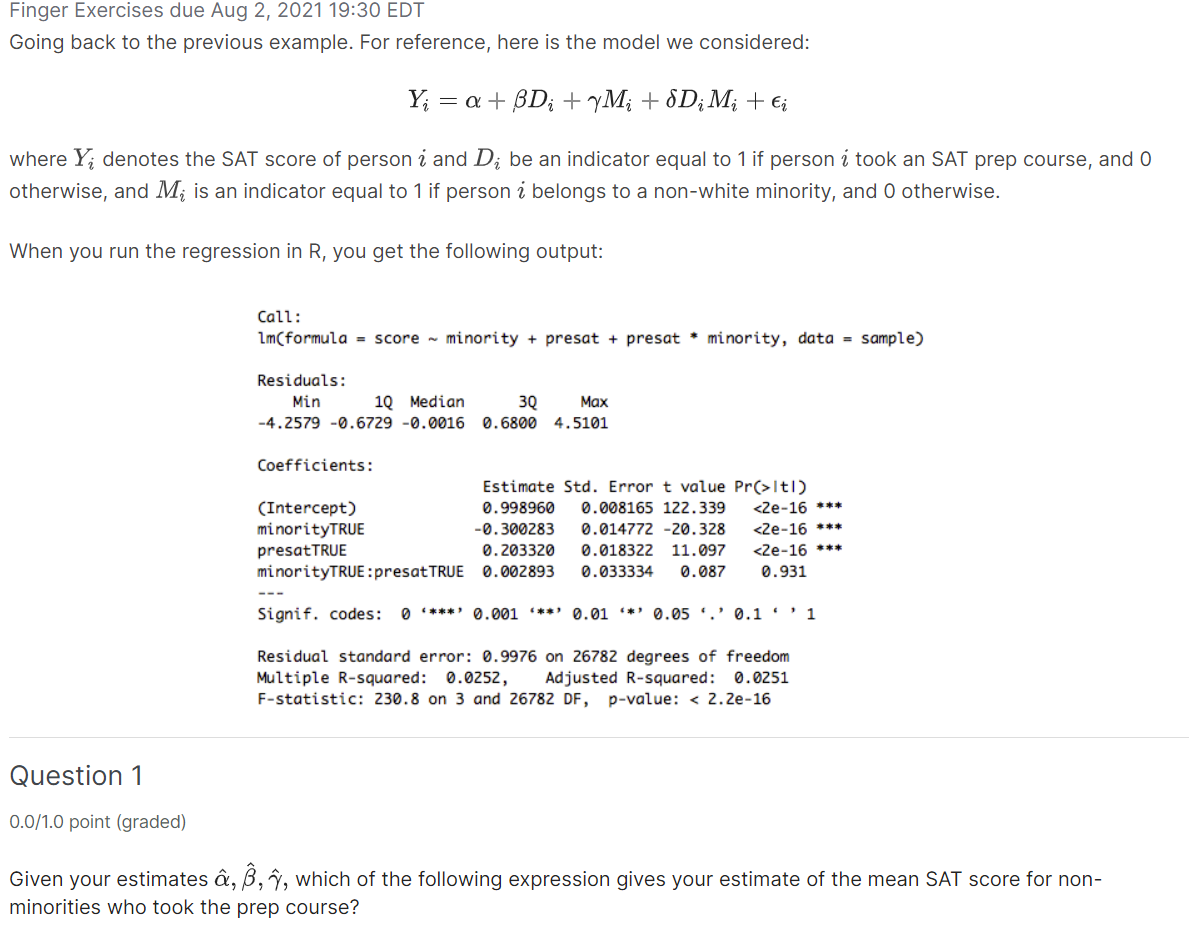
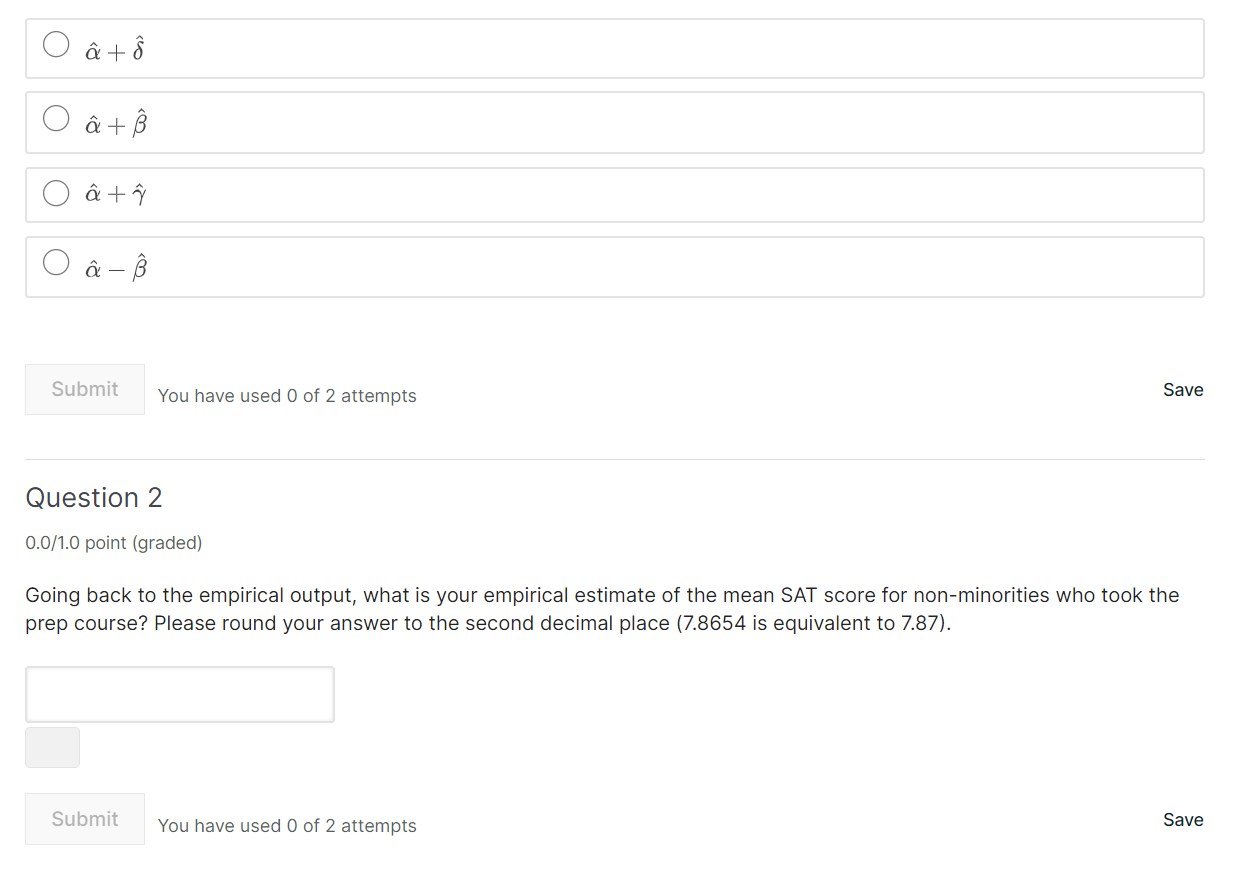
Suppose you run the following regression: Yi = a+ BMi+ ci where Y denotes the standardized SAT score of person i and M; be an indicator equal to 1 if person z belongs to a minority, and 0 otherwise. You have data from a sample of students from your university. You load it into R, and run the regression, and get the following output: Call: Im(formula = score ~ minority, data = sample) Residuals : Min 10 Median 3Q Max -3.6700 -0.6754 0. 0043 0.6722 4.0304 Coefficients: Estimate Std. Error t value Pr(>Itl) (Intercept) 1.038206 0. 007292 142.38 Itl) (Intercept) 0.998960 0. 008165 122.339 Itl) (Intercept) 0. 998960 0.008165 122.339
Step by Step Solution

There are 3 Steps involved in it

Step: 1

blur-text-image

Get Instant Access to Expert-Tailored Solutions

See step-by-step solutions with expert insights and AI powered tools for academic success

Step: 2

blur-text-image

Step: 3

blur-text-image

Ace Your Homework with AI

Get the answers you need in no time with our AI-driven, step-by-step assistance

Get Started

Recommended Textbook for

Linear Algebra With Applications

Authors: Gareth Williams, Williams

9th Edition

1284120104, 9781284120103

More Books

Students also viewed these Mathematics questions