| Suppose you sell five May 2011 silver futures contracts on March 29, 2011, at the last price of the day. Use Table 23.1 |
| What will your profit or loss be if silver prices turn out to be $37.12 per ounce at expiration? (Input the amount as a positive values.) |
| (Click to select)LossProfit | $ |
| What will your profit or loss be if silver prices are $36.78 per ounce at expiration? (Input the amount as a positive value.) |
| (Click to select)LossProfit | $ |
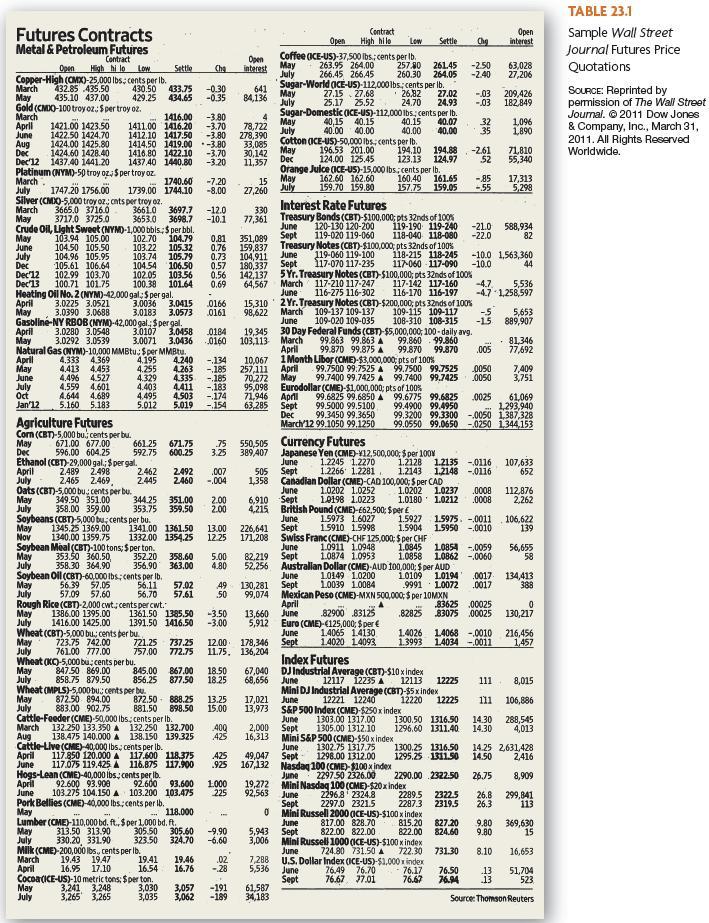
TABLE 23.1 Sample Wall Street Journal Futures Price Quotations SOURCE: Reprinted by permission of The Wall Street Journal. 2011 Dow Jones & Company, Inc., March 31, 2011. All Rights Reserved Worldwide. . March June Dec Futures Contracts Metal & Petroleum Futures Contract Open High Nilo Low Settle Copper-High (CMX)-25,000 lbs. cents per lb. March 132.85 435.50 430.50 433.75 May 435.10 437.00 429.25 434.65 Gold (CMO-100 troy 02.Sper troy oz. March -1416.00 April 1421.00 1423.50 1411.00 1416.20 June 1422.50 1424.70 1412.10 1417.50 Aug 1424.00 1425.80 1414.50 1419.00 Dec 1424.60 1428.40 1416,80 1422.10 Dec'12 1437.40 1441.20 1437 40 1440.80 Platinum (NYM)-50 troy oz. Sper troy oz 1740.60 July 1747.20 1756.00 1739.00 1744.10 Silver (CMO-5.000 troy oz. onts per troyo. March 3665.0 3716.0 3661.0 3697.7 May 3717,0 3725.0 3653.0 3698.7 Crude Oil, Light Sweet (NYM)-1,000 bbls. 5 per bbl. May 103.94 105.00 102.70 104.79 June 104.50 105.50 103.22 105.32 July 104.96 105.95 103.74 105.79 Dec 105.61 106.64 104.54 106.50 Dec 12 102.99 103.70 102.05 103.56 Dec 13 100.71 101.75 100.38 101.64 Heating Oil No. 2 (NYM)-42,000 gal, Spergal. April 3.0225 3.0521 3.0036 3.0415 May 3.0390 3.0688 3.0183 3.0573 Gasoline-NY RBOB (NYMO-42,000 gal. $ pergal. April 3.0280 3.0548 3.0107 3.0458 May 3.0292 3.0539 3.0071 3.0436 Natural Gas (NYM)-10,000 MMBtu: Sper MMBtu. April 4.333 4369 4.195 4.240 May 4.413 4.453 4.255 4.263 4,496 4.527 4.329 4.335 July 4.559 4.601 4.403 4.411 Oct 4.644 4.689 4,495 4.503 Jan'12 5.160 5.183 5.012 5.019 Agriculture Futures Corn (CBT)-5,000 bu.cents per bu. May 671.00 677.00 661.25 671.75 596.00 604.25 592.75 600.25 Ethanol (CBT)-29,000 gal; Spergal. April 2.489 2.498 2.462 2.492 2465 2.469 2.445 2460 Oats (CBT)-5,000 bu.cents per bu. May 349.50 351.00 344.25 351.00 358.00 359.00 353.75 359.50 Soybeans (CBT)-5,000 bu, cents per bu. May 1345.25 1369.00 1341.00 1361.50 Nov 1340.00 1359.75 1332.00 1354.25 Soybean Meal (CBT)-100 tons: Sper ton. May 353.50 360.50 352.20 358.60 July 358.30 364.90 356.90 363.00 Soybean Oll(CBT)-60,000 lbs.:cents per Ib. May 56.39 $9.05 56.11 57.02 July 57.09 57,60 56.70 57.61 Rough Rice (CBT) 2,000 cwt cents percut. May 1386.00 1395.00 1361.50 1385.50 July 1416.00 1425.00 1391.50 1416.50 Wheat (CBT)-5,000 bucats per bu May 723.75 742.00 721.25 737.25 July 761.00 777.00 757.00 772.75 Wheat (KC)-5,000 bu, cents per bu. May 847.50 869.00 845.00 867.00 July 858.75 879.50 856.25 877.50 Wheat (MPLS)-5.000bucents per bu. May 872.50 894.00 872.50 - 888.25 July 883.00 902.75 881.50 898.50 Cattle-Feeder (CME) 50,000 lbs cents per lb. March 132.250 133.350 A 132.250 132.700 Aug 138.475 140.000 A 138.150 139.325 Cattle-Live (CME) 40,000 lbs, cents per lb April 117.850 120.000 A 117.600 118.375 Juhe 117.075 119.425 A 116.875 117.900 Hogs-Lean (CME)-40,000 lbs. cents per lb. Aprill 92.600 93.908 92.600 93.600 June 103.275 104.150 A 103.200 103.475 Pork Bellies (CME) 40,000 lbs.:cents per Ib. May 118.000 Lumber (CME)-110,000 bd. ft. Sper 1.000 bd. ft. May 313.50 313.90 305.50 305.60 July 330.20 331.90 323.50 324.70 Milk (CME)-200,000 lbs, cents per lb. March 19.43 1947 19.41 19.46 April 16.95 17.10 16.54 16.76 Cocoa (ICE-US)-10 metric tons, $perton. May 3,241 3.248 3,057 July 3,265 3,265 3,035 3,062 Contract Open Open High Nilo Low Settle Chg interest Open Coffee (ICE-US)-37,500 lbs, cents per lb. Cha interest May 263.95 264.00 257.30 261.45 -2.50 63,028 July 266.45 266.45 260.30 264.05 -2.40 27,206 -0.30 641 Sugar-World (ICE-US)-112,000 lbs:cents per lb. -0.35 May 27.15 27.68 26,82 84,136 27.02 --03 209,426 July 25.17 25.52 24.70 24.93 -,03 182,849 -3.80 Sugar-Domestic (ICE-US)-112,000 lbs, cents per lb. 4 -3.70 May 40.15 40,15 40.15 78,722 40.07 32 1,096 -3.80 July 278,390 40.00 40.00 40.00 40.00 35 1,890 -3.80 33,085 Cotton (ICE-US)-50,000 lbs.cents per Ib. -3.70 30,142 May 196.53 201.00 194.10 194.88 -2.61 71,810 -3.20 11,357 Dec 124.00 125.45 123.13 124.97 52 55,340 Orange Juice (ICE-US)-15,000 lbs, cents per lb. -7.20 15 May 162.60 162.60 160.40 161.65 -85 17,313 -8.00 27,260 July 159.70 159.80 157.75 159.05 -55 5,298 -12.0 330 Interest Rate Futures -10.1 77,361 Treasury Bonds (CBT-$100.000; pts 32nds of 100% June 120-130 120-200 119-190 119-240 -21.0 588,934 0.81 351,089 Sept 119-020 119-060 118-040 118-080 -22.0 82 0.76 159,837 Treasury Notes (CBT)-$100,000, pts 32nds of 100% 0.73 104,911 June 119-060 119-100 118-215 118-245 -10.0 1.563,360 0.57 180,337 Sept 117-070 117-235 117060 117-090 -10.0 44 0.56 142,137 5Yr. Treasury Notes (CBT)-$100,000, pts 32nds of 100% 0.69 64,567 March 117-210 117-247 117-142 117-160 -4.7 5,536 June 116-275 116-302 116-170 116-197 -4.7-1,258,597 .0166 15,310' 2 Yr. Treasury Notes (CBT)-$200,000, pts 32nds of 100% .0161 98,622 March 109-137 109-137 109-115 109-117 -5 5,653 June 109-020 109-035 108-310 108-315 -15 889,907 _0184 19,345 30 Day Federal Funds (CBT)-$5,000,000, 100-dally avg. 0160 103,113 March 99.863 99.863 A 99.860 99.860 81,346 April 99.870 99.875 A 99.870 99.870 .005 77,692 -134 10,067 1 Month Libor (CME)-$3,000,000; pts of 100% -185 257,111 April 99.7500 99.7525 A 99.7500 99.7525 0050 7,409 -185 70.272 May 99.7400 99.7425 A 99.7400 99.7425 0050 3.751 -.183 95,098 Eurodollar (CME)-$1,000,000; pts of 100% -174 71.946 April 99.6825 99.6850 A 99.6775 99.6825 .0025 61,069 -154 63,285 Sept 99.5000 99.5100 99.4900 99.4950 1,293,940 Dec 99.3450 99.3650 99.3200 99.3300-0050 1,387,328 Marcly12 99.1050 99.1250 99.0550 99.0650 -0250 1.344 153 .75 550,505 Currency Futures 3.25 389,407 Japanese Yen (CME-V12,500,000 $ per 100 June 1.2245 1.2270 1.2128 1.2135 -0116 107,633 .007 505 Sept 1.22661.2281 1.2143 1.2148 -0116 652 -,004 1,358 Canadian Dollar (CME)-CAD 100,000;5 per CAD June 1.0202 1.0252 1.0202 1.0237 .0008 112,876 200 6,910 Sept 10198 1.0223 1.0180' 1.0212 .0008 2,262 2.00 4.215 British Pound (CME)-62,500 $ per June 1.5973 1.6027 1.5927 1.5975-0011 106,622 13.00 226,641 Sept 1.5910 1.5998 1.5904 1.5950 - 0010 139 12.25 171,208 Swiss Franc (CME) CHF 125,000; Sper CHF June 1.0911 1.0948 1.0845 10854 -.0059 56,655 5.00 82.219 Sept 1.0874 1.0953 1.0858 1.0862-.0060 58 4.80 52,256 Australian Dollar (CME) AUD 100,000 $ per AUD June 10149 1.0200 10109 1.0194 0017 134,413 49 130,281 Sept L0039 1.0084 9991 10072 .0017 388 .50 99,074 Mexican Peso (CME)-MXN 500,000;$per 10MXN April A 83625.00025 0 -3.50 13,660 June 82900.83125 .82825 83075 00025 130,217 -3.00 5,912 Euro (CME)-125,000 $per June 1.4065 1.4130 1.4026 1.4068 -0010 216,456 12.00 178,346 Sept 1.4020 14092 1.3993 1.4034 - 0011 1,457 11.75, 136,204 Index Futures 18.50 67,040 DJ Industrial Average (CBT)-$10 x Index 18.25 68,656 June 12117 12235 A 12113 12225 111 8,015 Mini DJ Industrial Average (CBT)-$5 x Index 13.25 17,021 June 12221 12240 12220 12225 111 15.00 13,973 106,886 S&P 500 Index (CME)-$250 x index June 1303.00 1317.00 1300.50 1316.50 14.30 288,545 .400 2,000 Sept 1305.00 1312.10 1296.60 1311.40 14.30 4,013 .425 16,313 Mini S&P 500 (CME)-$50 x index June 1302.75 1317.75 1300.25 1316.50 14.25 2,631,428 425 49,047 Sept 1298.00 1312.00 1295.25 1311.50 14.50 2.416 .925 167,132 Nasdaq 100(CME) $200 x index June 2297 50 2326.00 2290.00 .2322.50 26.75 8,909 1.000 19,272 Mini Nasdaq 100(CME)-$20 x Index 225 92,563 June 2296.82324.8 2289.5 2322.5 299,841 Sept 2297.0 2321.5 2297.3 2319.5 26.3 113 0 Mini Russell 2000 ICE-US)-$100 x Index June 817.00 828.70 815.20 827.20 9.80 -9.90 5,943 369,630 Sept 822.00 822.00 822.00 824.60 9.80 15 -6.60 3,006 Mini Russell 1000 (ICE-US)-$100 x index June 724.80 731.50 A 722.30 731.30 8.10 16,653 .02 7288 U.S. Dollar Index (ICE-US)-$1.000 index - 28 5,536 June 26.49 76.70 76.17 76.50 13 51,704 Sept 76.67 77.01 76.67 76.94 .13 523 -191 61.587 -189 34,183 Source: Thomson Reuters July July 26.8 3,030