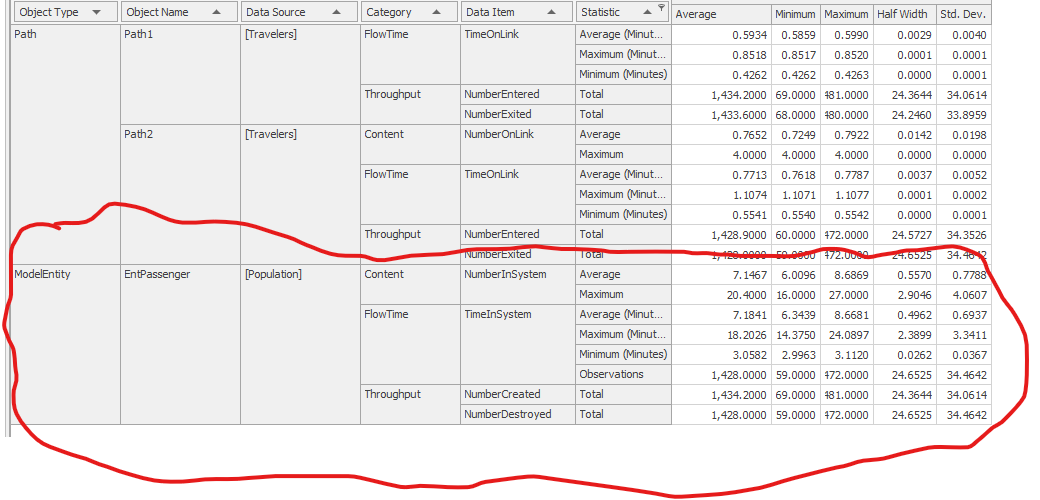
- Suppose you want the average number in the system for Passengers to be within 5% of its mean? How many replications would be needed given the previous half width calculation?
- Suppose you want the maximum number in the system for Passengers to be within 2 passengers? How many replications would be needed?
- Please use the calculations in the red circle for the questions.

Data Source Object Type - Path Object Name Path 1 Category Flow Time Data Item TimeOnLink [Travelers] Statistic 7 Average (Minut. Maximum (Minut... Minimum (Minutes) Total Throughput NumberEntered NumberExited NumberOnLink Total Path2 (Travelers] Content FlowTime TimeOnLink Average Maximum Average (Minut.. Maximum (Minut Minimum (Minutes) Total Average Minimum Maximum Half Width Std. Dev. . 0.5934 0.5859 0.5990 0.0029 0.0040 0.8518 0.8517 0.8520 0.0001 0.0001 0.4262 0.4262 0.4263 0.0000 0.0001 1,434.2000 69.0000 181.0000 24.3644 34.0614 1,433.6000 68.0000 180.0000 24.2460 33.8959 0.7652 0.7249 0.7922 0.0142 0.0198 4.0000 4.0000 4.0000 0.0000 0.0000 0.7713 0.7618 0.7787 0.0037 0.0052 1. 1074 1. 1071 1. 1077 0.0001 0.0002 0.5541 0.5540 0.5542 0.0000 0.0001 1,428.9000 60.0000 172.0000 24.5727 34.3526 * 17120.000 60.000 72.00.0 24.6525 34.402 7.1467 6.0096 8.6869 0.5570 0.7788 20.4000 16.0000 27.0000 2.9046 4.0607 7.1841 6.3439 8.6681 0.4962 0.6937 18.2026 14.3750 24.0897 2.3899 3.3411 3.0582 2.9963 3.1120 0.0262 0.0367 1,428.0000 59.0000 172.0000 24.6525 34.4642 1,434.2000 69.0000 181.0000 24.3644 34.0614 1,428.0000 59.0000 472.0000 24.6525 34.4642 Throughput NumberEntered NumberExited Total ModelEntity EntPassenger [Population] Content Number InSystem Average Maximum FlowTime TimeInSystem Average (Minut. Maximum (Minut. Minimum (Minutes) Observations Total Total Throughput NumberCreated NumberDestroyed Data Source Object Type - Path Object Name Path 1 Category Flow Time Data Item TimeOnLink [Travelers] Statistic 7 Average (Minut. Maximum (Minut... Minimum (Minutes) Total Throughput NumberEntered NumberExited NumberOnLink Total Path2 (Travelers] Content FlowTime TimeOnLink Average Maximum Average (Minut.. Maximum (Minut Minimum (Minutes) Total Average Minimum Maximum Half Width Std. Dev. . 0.5934 0.5859 0.5990 0.0029 0.0040 0.8518 0.8517 0.8520 0.0001 0.0001 0.4262 0.4262 0.4263 0.0000 0.0001 1,434.2000 69.0000 181.0000 24.3644 34.0614 1,433.6000 68.0000 180.0000 24.2460 33.8959 0.7652 0.7249 0.7922 0.0142 0.0198 4.0000 4.0000 4.0000 0.0000 0.0000 0.7713 0.7618 0.7787 0.0037 0.0052 1. 1074 1. 1071 1. 1077 0.0001 0.0002 0.5541 0.5540 0.5542 0.0000 0.0001 1,428.9000 60.0000 172.0000 24.5727 34.3526 * 17120.000 60.000 72.00.0 24.6525 34.402 7.1467 6.0096 8.6869 0.5570 0.7788 20.4000 16.0000 27.0000 2.9046 4.0607 7.1841 6.3439 8.6681 0.4962 0.6937 18.2026 14.3750 24.0897 2.3899 3.3411 3.0582 2.9963 3.1120 0.0262 0.0367 1,428.0000 59.0000 172.0000 24.6525 34.4642 1,434.2000 69.0000 181.0000 24.3644 34.0614 1,428.0000 59.0000 472.0000 24.6525 34.4642 Throughput NumberEntered NumberExited Total ModelEntity EntPassenger [Population] Content Number InSystem Average Maximum FlowTime TimeInSystem Average (Minut. Maximum (Minut. Minimum (Minutes) Observations Total Total Throughput NumberCreated NumberDestroyed


