

Answered step by step
Verified Expert Solution
Question
1 Approved Answer
Suppose you want to make a gauge chart on website traffic in the same format as in the presentation. This gauge chart was based on
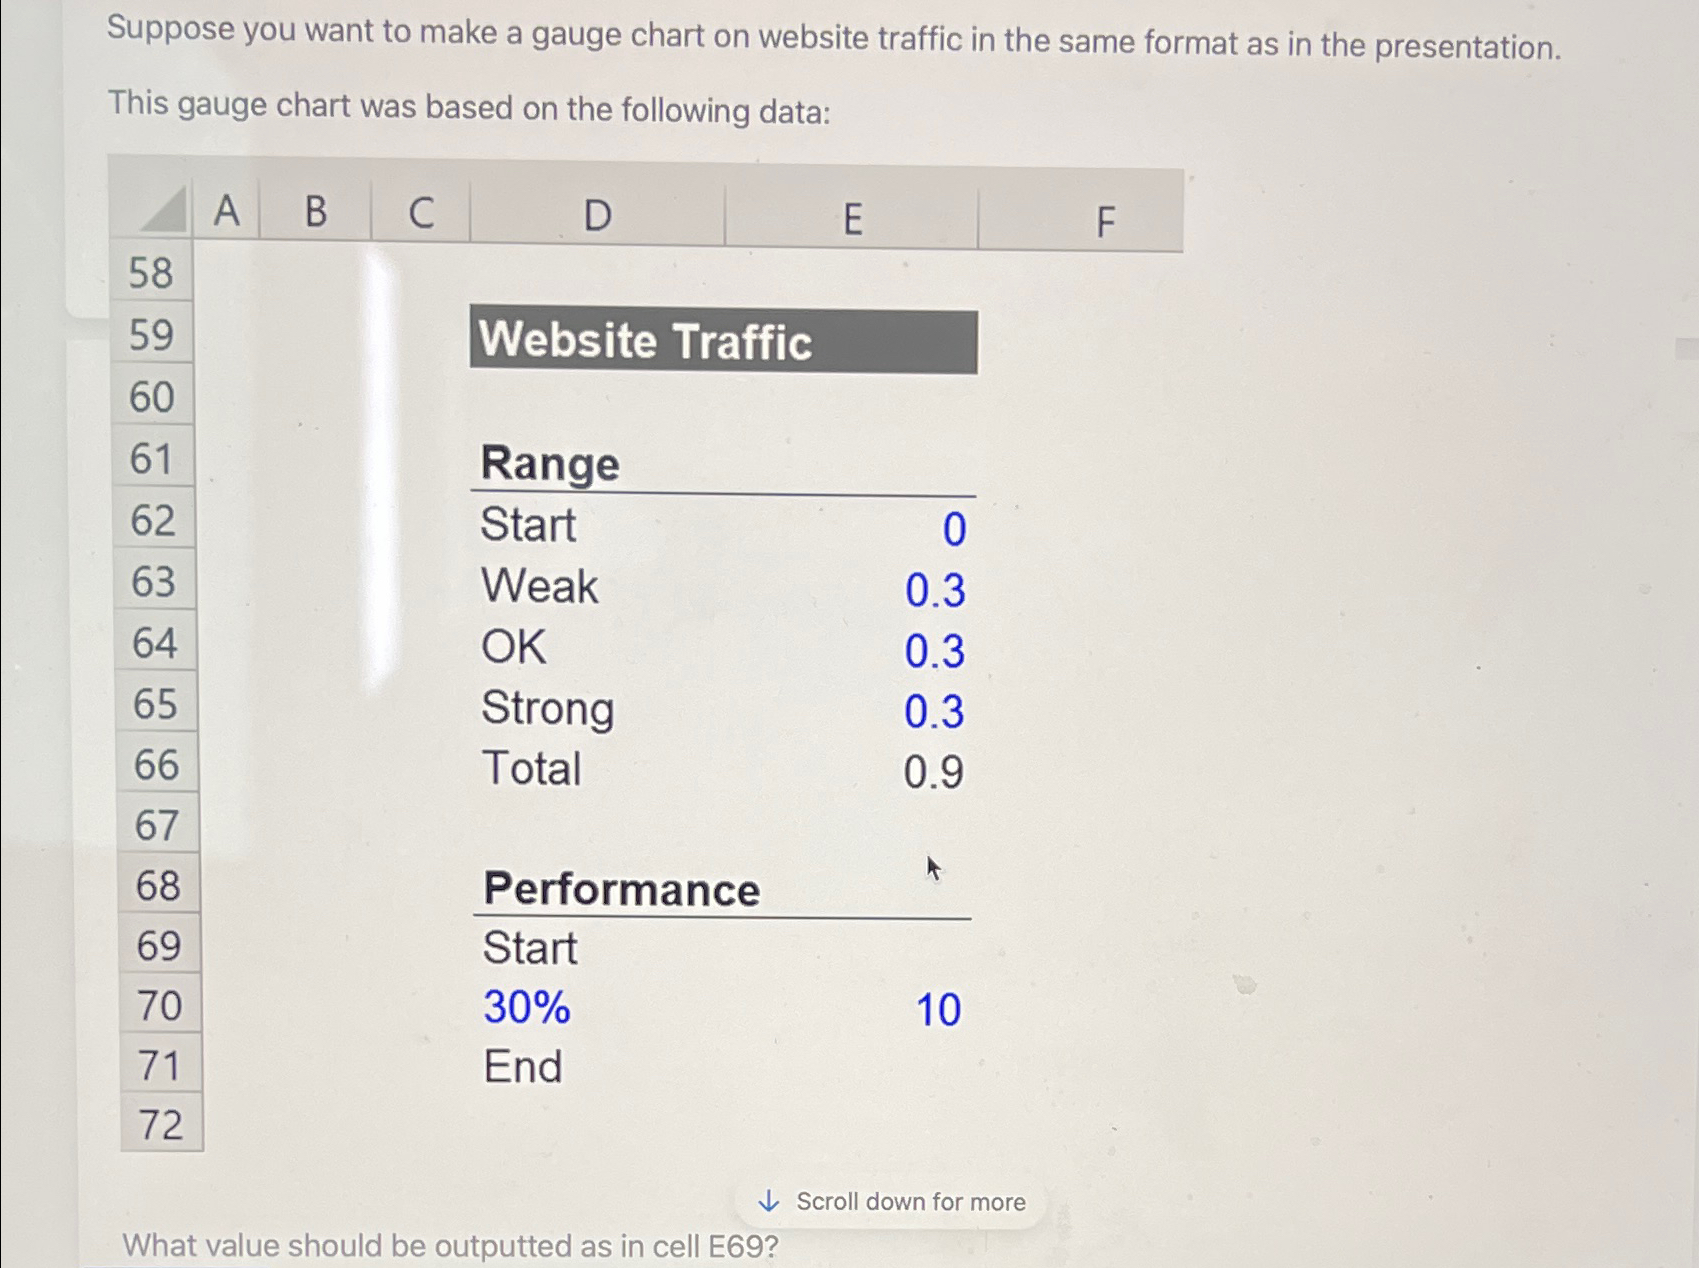
Suppose you want to make a gauge chart on website traffic in the same format as in the presentation.
This gauge chart was based on the following data:
tableBCDEWebsite TrafficRangeStart,Weak,OKStrong,Total,PerformanceStartEnddown
What value should be outputted as in cell E
Step by Step Solution
There are 3 Steps involved in it
Step: 1

Get Instant Access to Expert-Tailored Solutions
See step-by-step solutions with expert insights and AI powered tools for academic success
Step: 2

Step: 3
Ace Your Homework with AI
Get the answers you need in no time with our AI-driven, step-by-step assistance
Get Started
Database Systems Design Implementation And Management
Authors: Peter Rob, Carlos Coronel
3rd Edition
0760049041, 978-0760049044