Answered step by step
Verified Expert Solution
Link Copied!

Question

1 Approved Answer

Suppose you want to plot a quadratic function y = ax^2 + bx + c with the user specifying the coefficients Suppose also that you
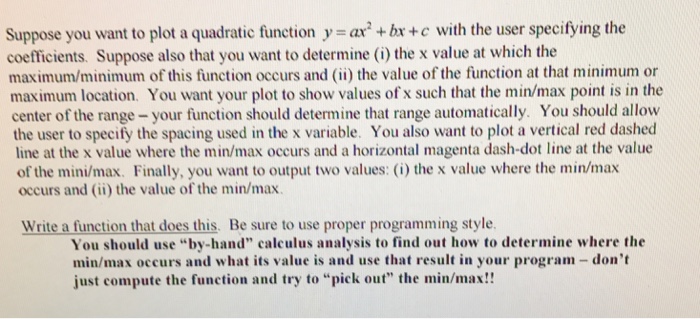
image text in transcribed
Suppose you want to plot a quadratic function y = ax^2 + bx + c with the user specifying the coefficients Suppose also that you want to determine (i) the x value at which the maximum/minimum of this function occurs and (ii) the value of the function at that minimum or maximum location You want your plot to show values of x such that the min/max point is in the center of the range - your function should determine that range automatically. You should allow the user to specify the spacing used in the x variable You also want to plot a vertical red dashed line at the x value where the min/max occurs and a horizontal magenta dash-dot line at the value of the mini/max Finally, you want to output two values (i) the x value where the min/max occurs and (ii) the value of the min/max Write a function that does this Be sure to use proper programming style You should use "by-hand" calculus analysis to find out how to determine where the min/max occurs and what its value is and use that result in your program - don't just compute the function and try to "pick out" the min/max

Step by Step Solution

There are 3 Steps involved in it

Step: 1

blur-text-image

Get Instant Access to Expert-Tailored Solutions

See step-by-step solutions with expert insights and AI powered tools for academic success

Step: 2

blur-text-image

Step: 3

blur-text-image

Ace Your Homework with AI

Get the answers you need in no time with our AI-driven, step-by-step assistance

Get Started

Recommended Textbook for

Database Concepts

Authors: David M. Kroenke, David J. Auer

7th edition

133544621, 133544626, 0-13-354462-1, 978-0133544626

More Books

Students also viewed these Databases questions

Question

7. What is coaching? Is there only one type of coaching? Explain.

Answered: 1 week ago