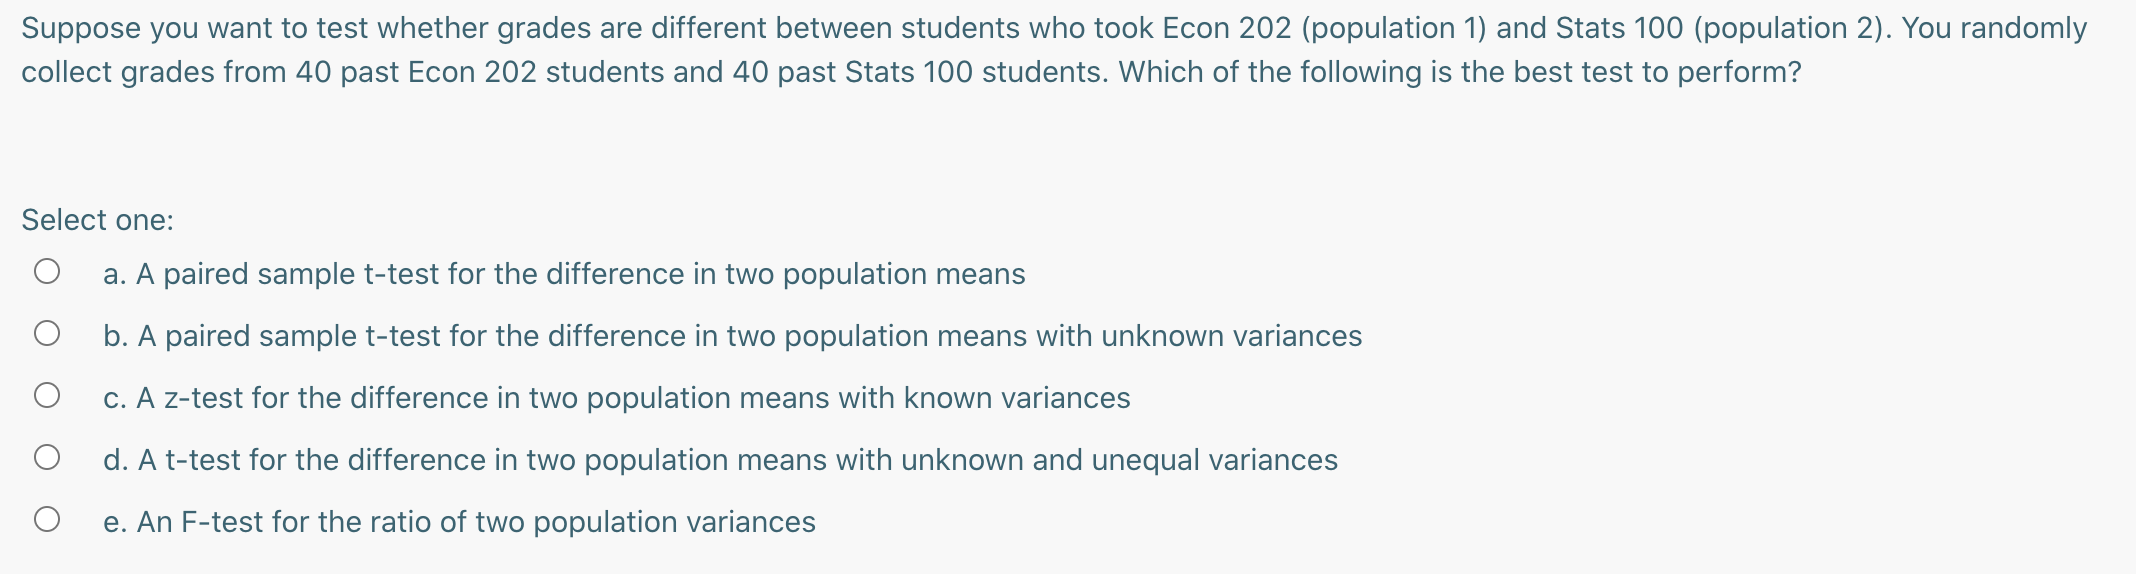
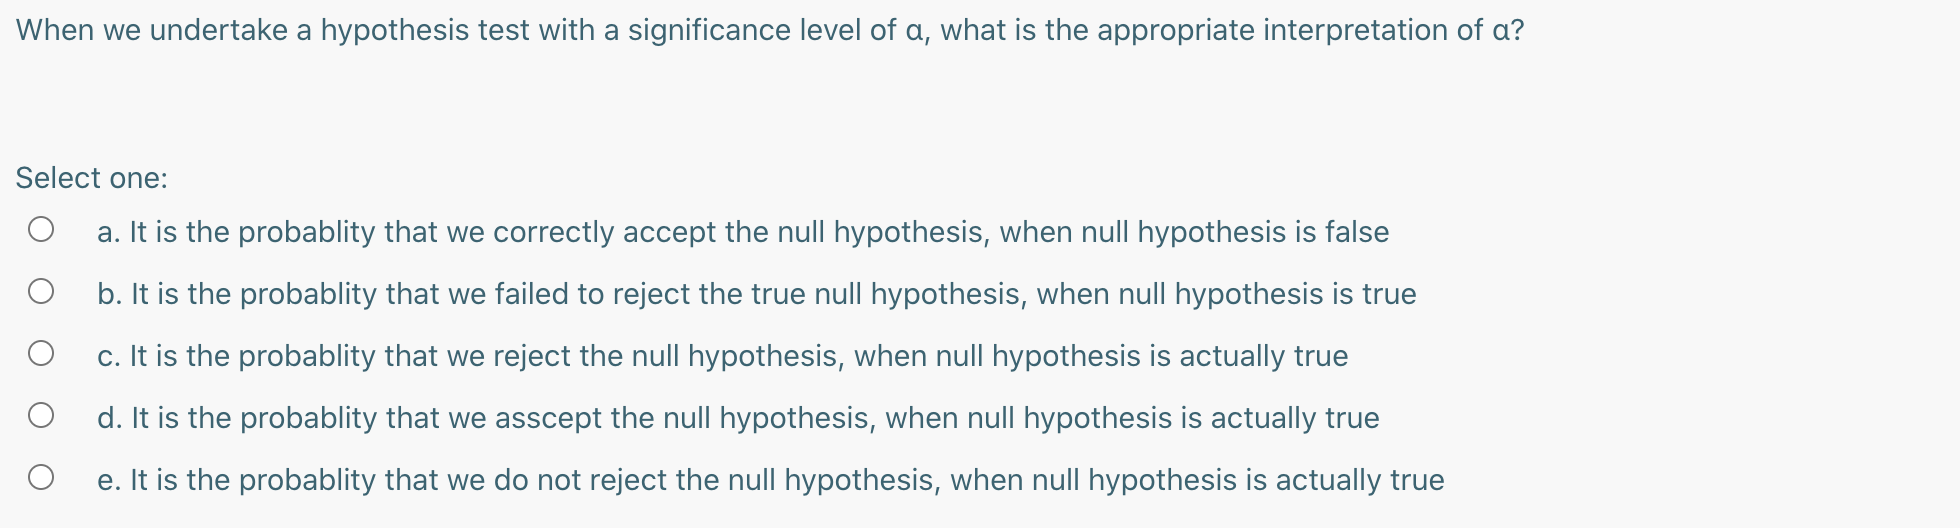
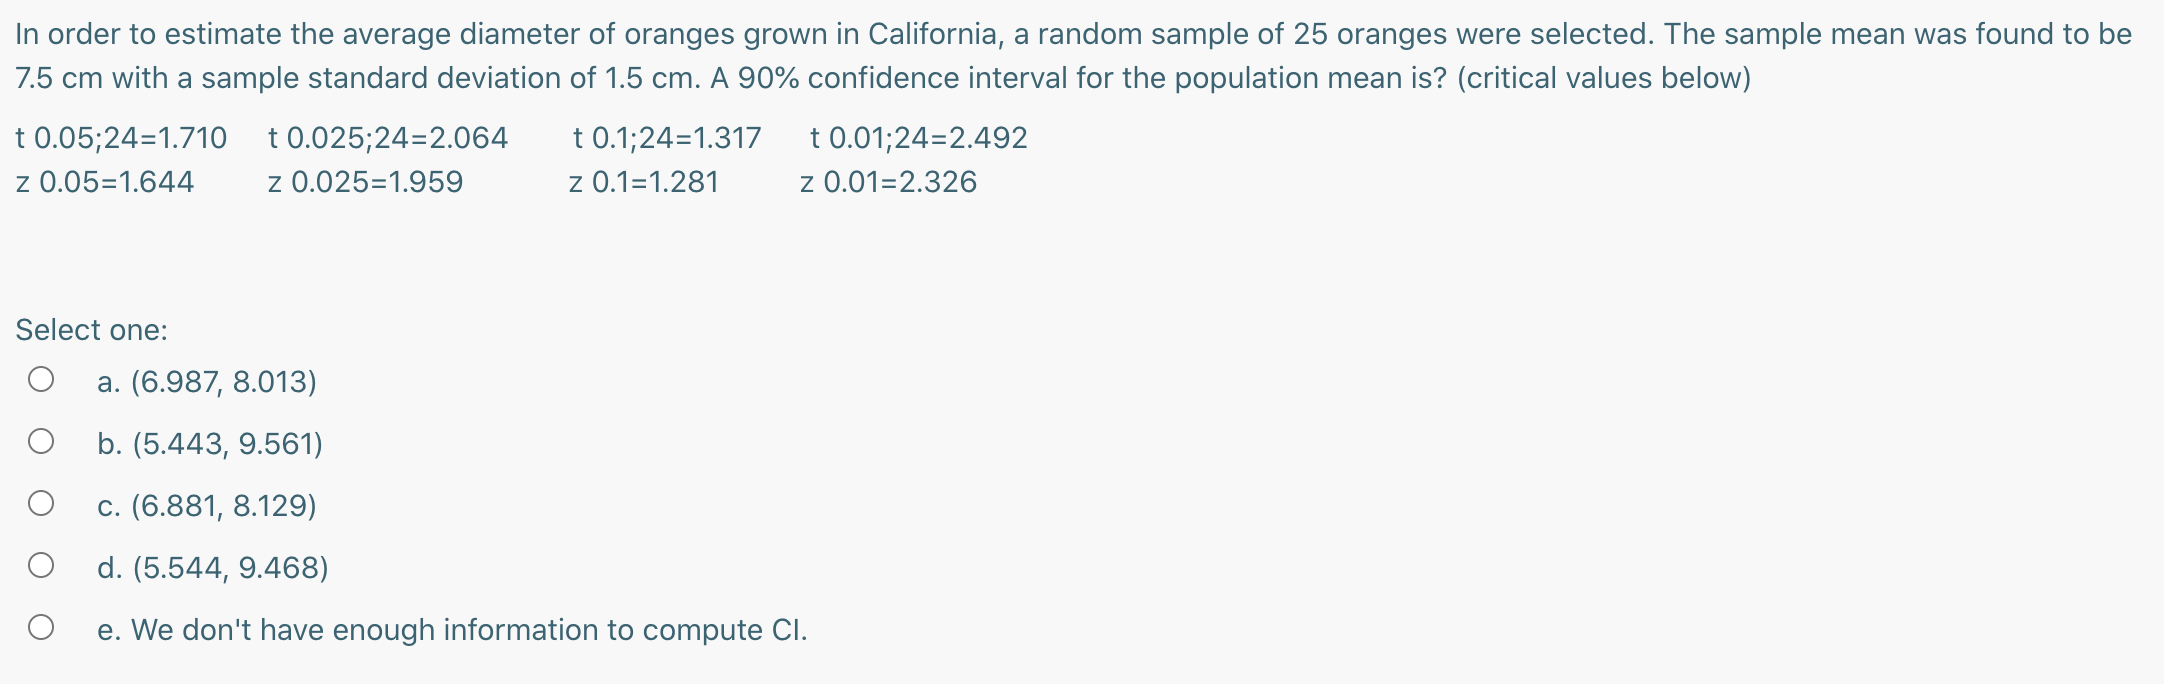
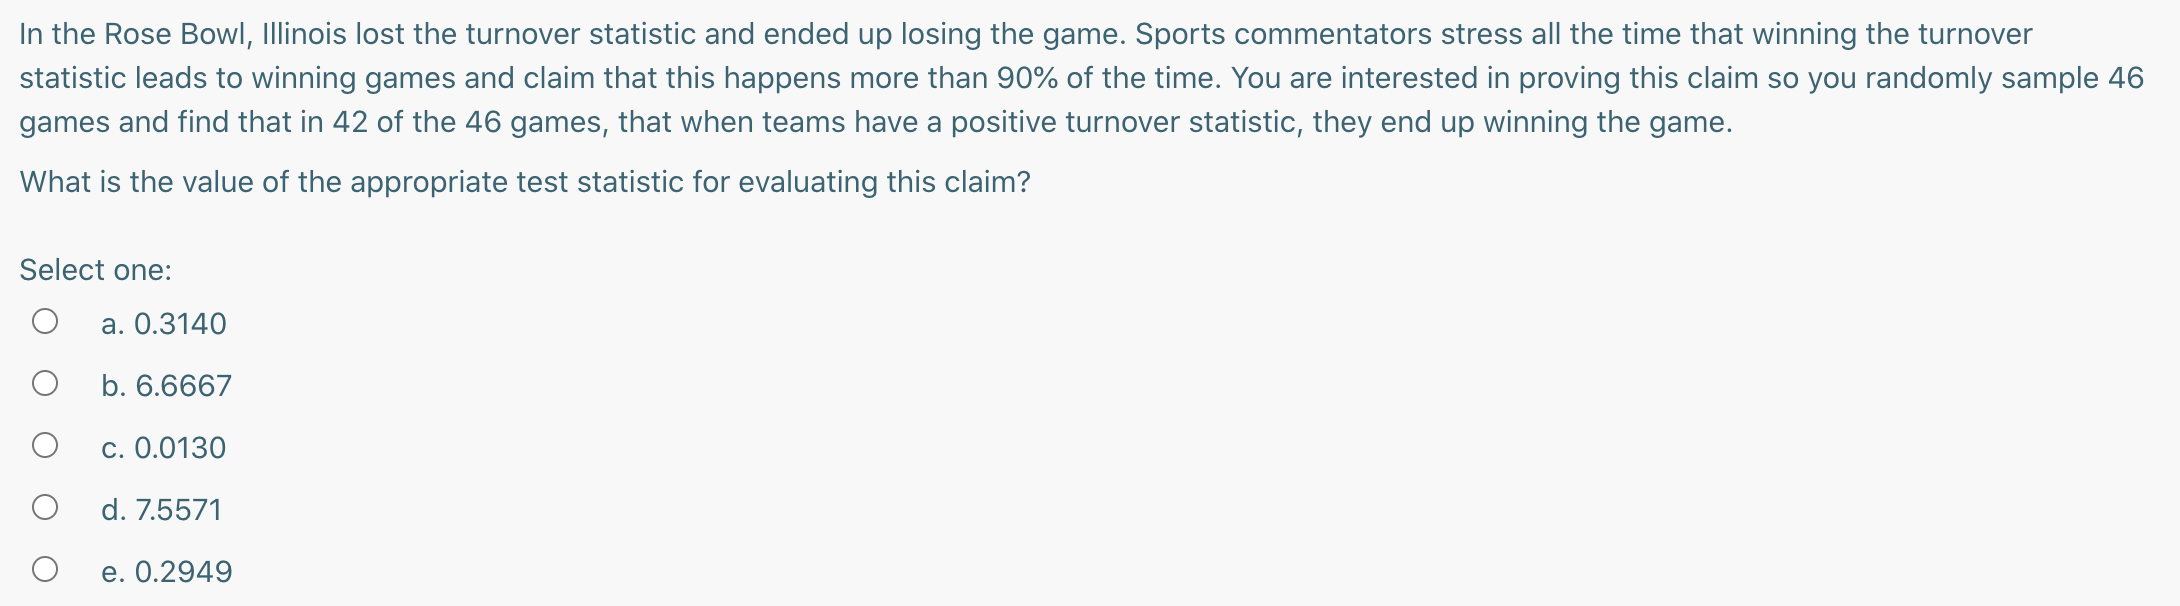
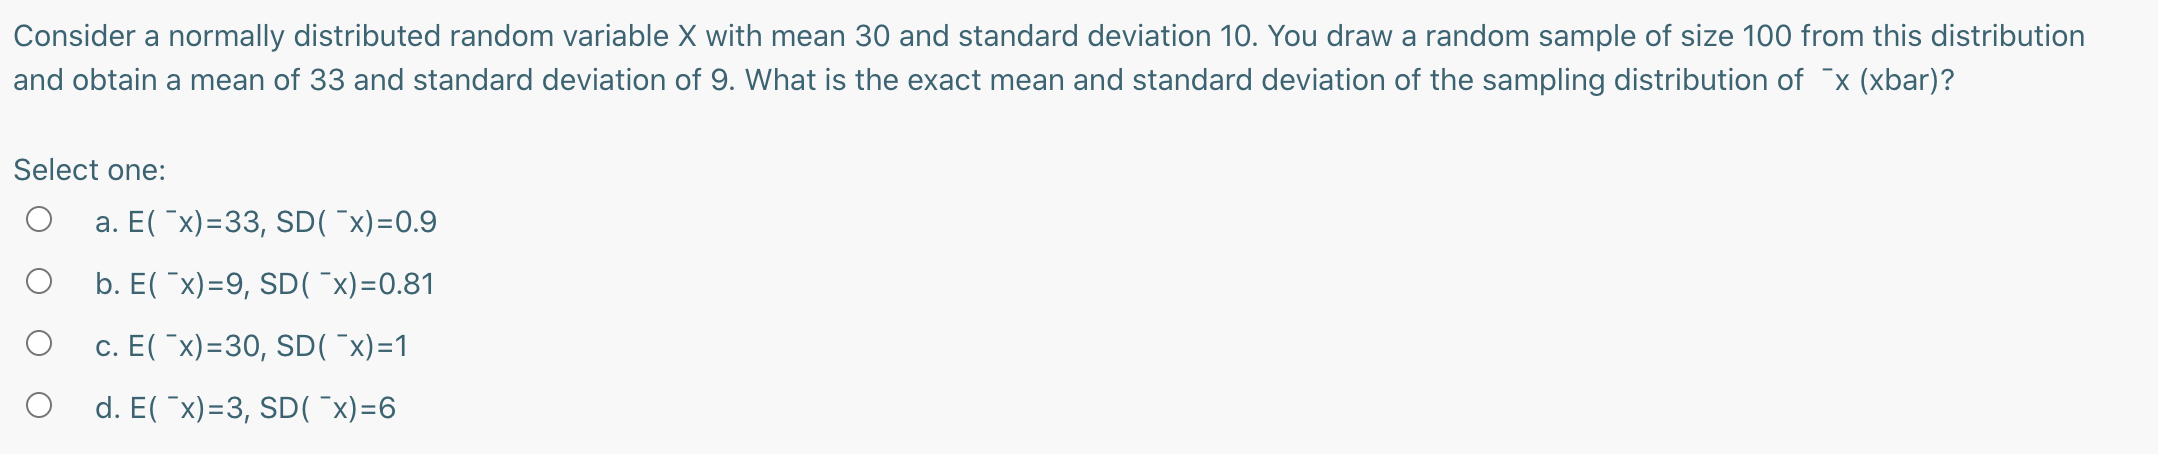
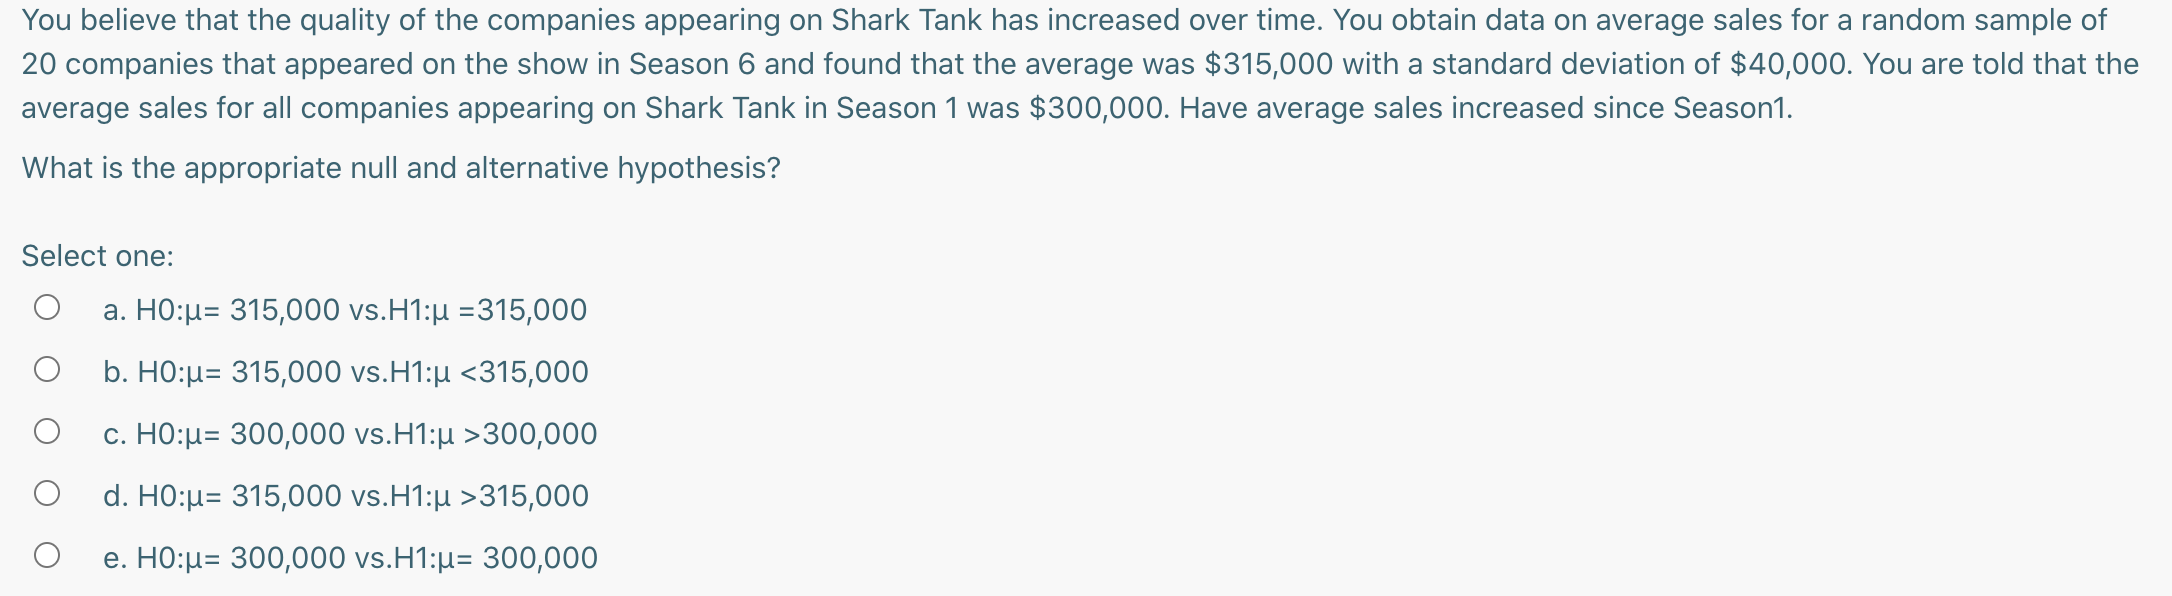
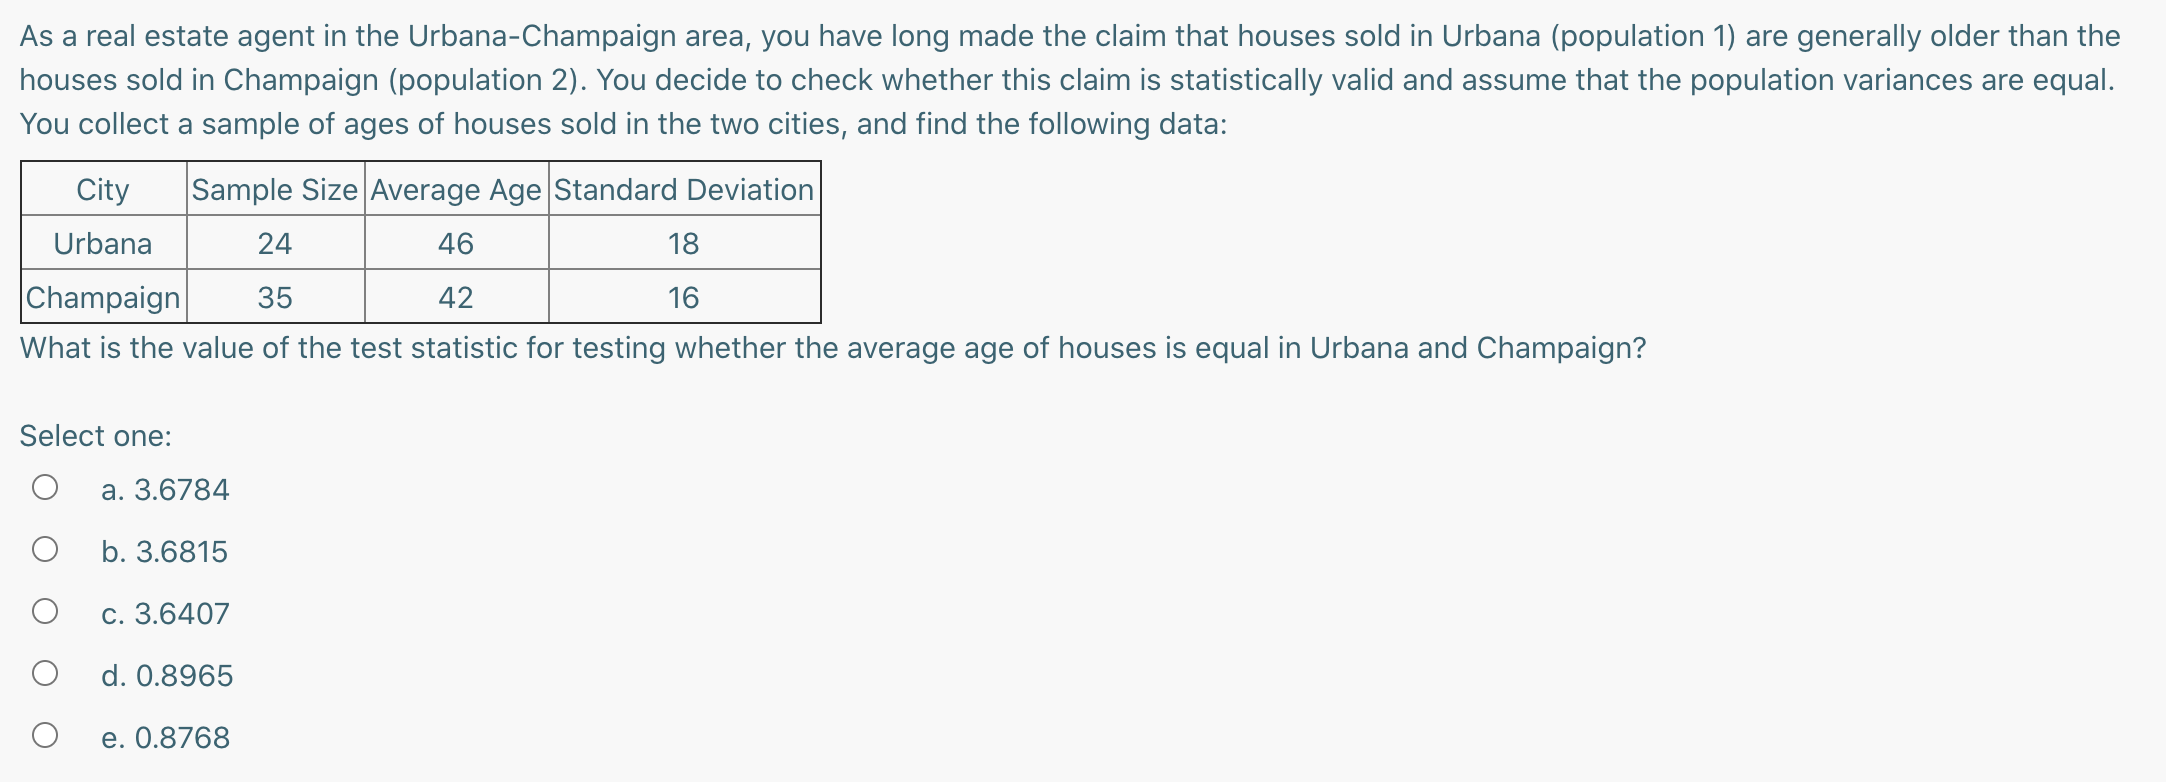
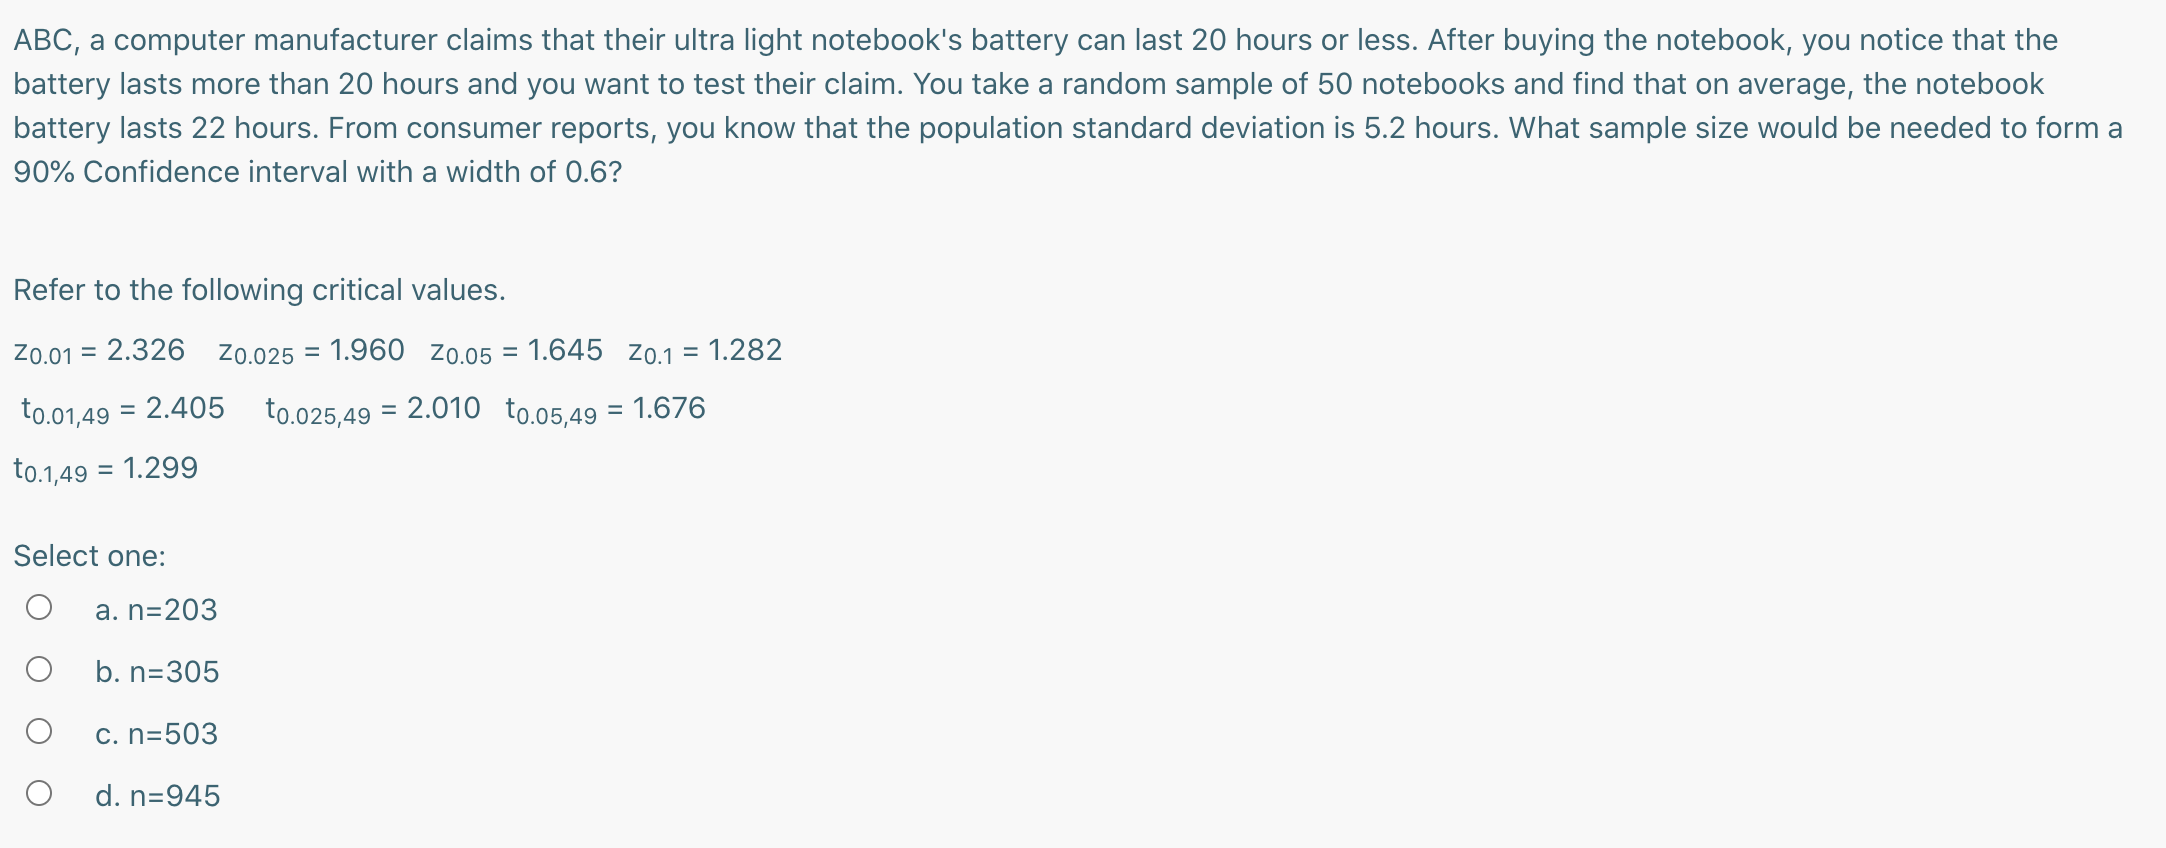
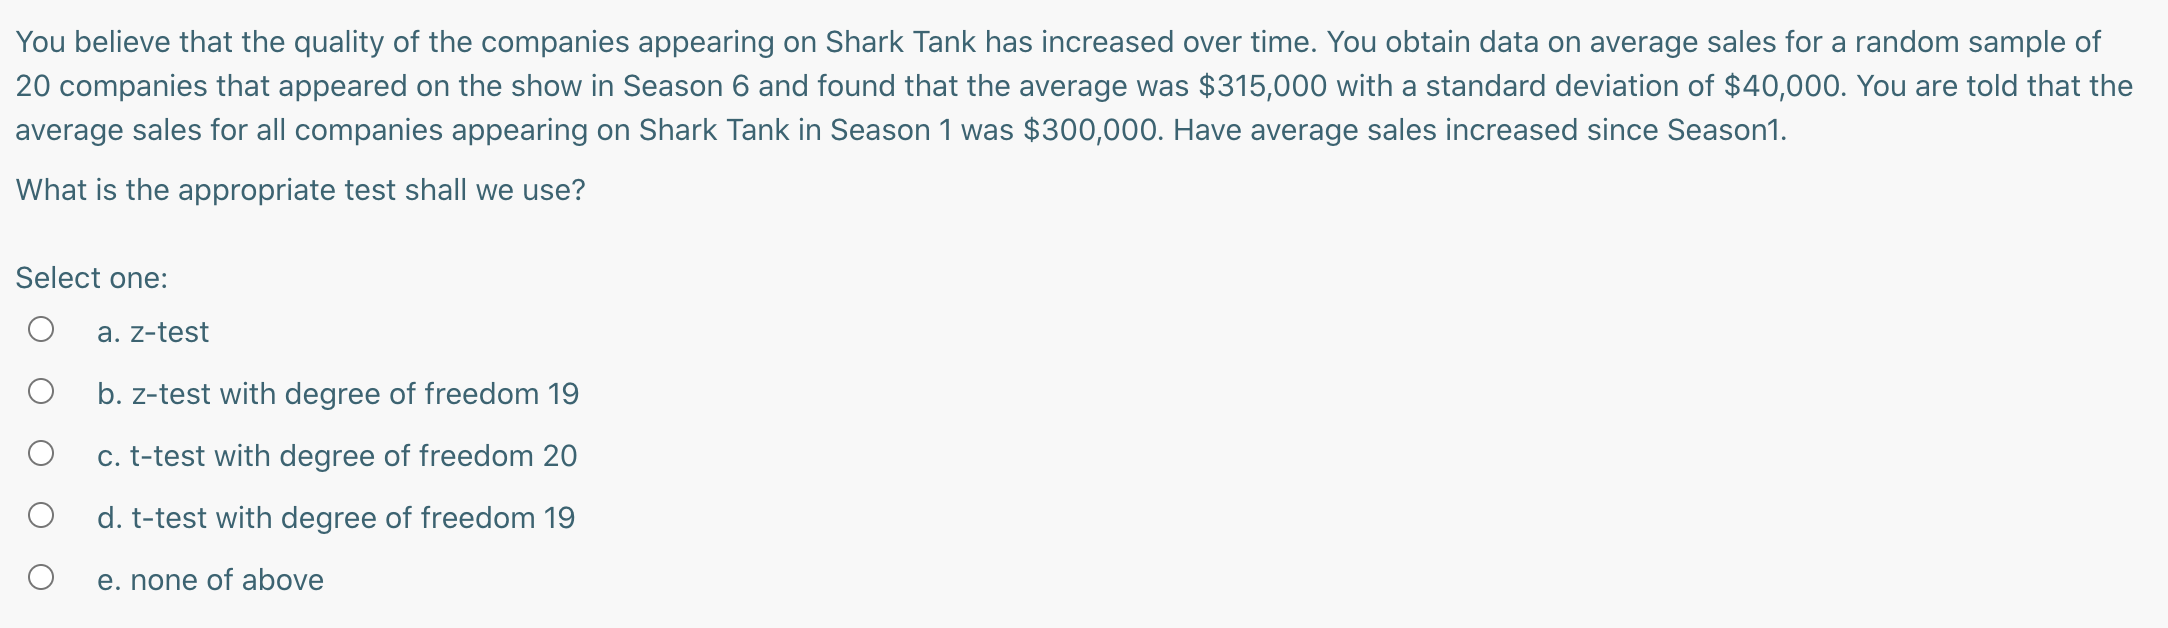
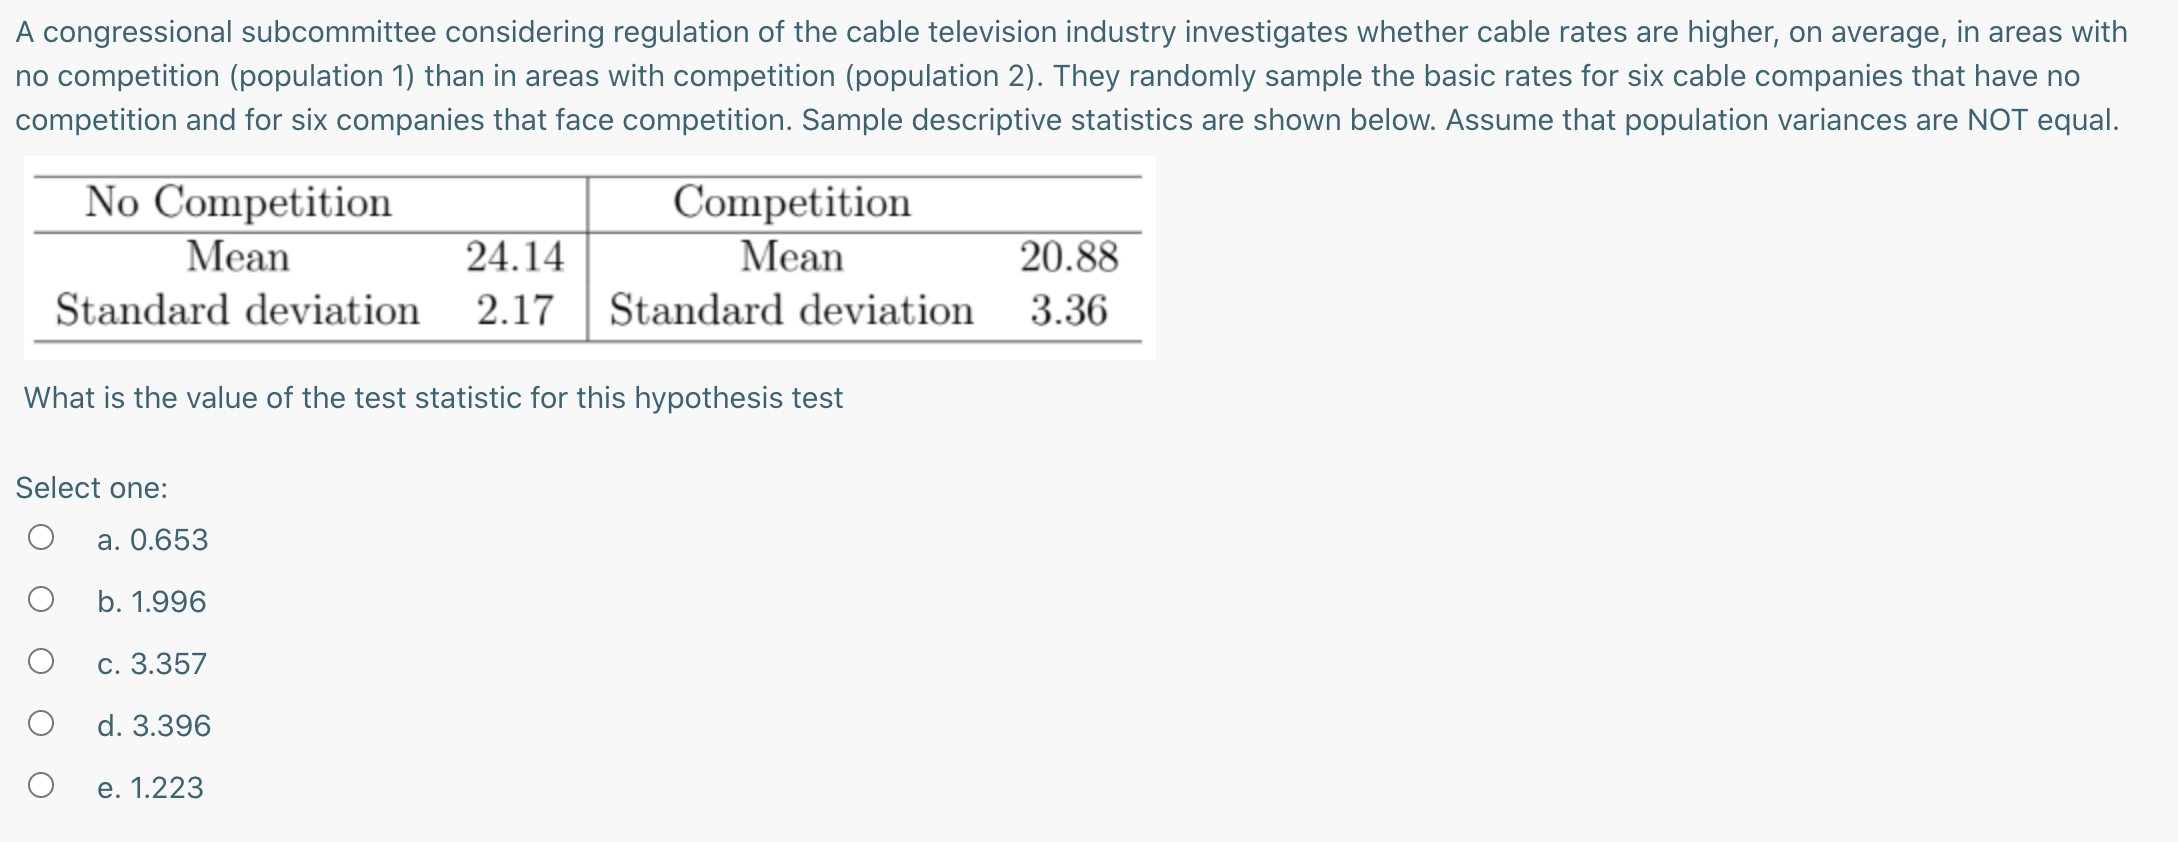
Suppose you want to test whether grades are different between students who took Econ 202 (population 1) and Stats 100 (population 2). You randomly collect grades from 40 past Econ 202 students and 40 past Stats 100 students. Which of the following is the best test to perform? Select one: Q a. A paired sample t-test for the difference in two population means b. A paired sample t-test for the difference in two population means with unknown variances c. A ztest for the difference in two population means with known variances d. A t-test for the difference in two population means with unknown and unequal variances 0000 e. An F-test for the ratio of two population variances When we undertake a hypothesis test with a significance level of u, what is the appropriate interpretation of a? Select one: O 0000 a. It is the probablity that we correctly accept the null hypothesis, when null hypothesis is false b. It is the probablity that we failed to reject the true null hypothesis, when null hypothesis is true 0. It is the probablity that we reject the null hypothesis, when null hypothesis is actually true d. It is the probablity that we asscept the null hypothesis, when null hypothesis is actually true e. It is the probablity that we do not reject the null hypothesis, when null hypothesis is actually true In order to estimate the average diameter of oranges grown in California, a random sample of 25 oranges were selected. The sample mean was found to be 7.5 cm with a sample standard deviation of 1.5 cm. A 90% confidence interval for the population mean is? (critical values below) t 0.05;24=1.710 t 0.025;24=2.064 t 0.1;24=1.317 t 0.01;24=2.492 Z 0.05:1.644 Z 0025:1959 Z 0.1='l.28'l Z 0.01:2.326 Select one: Q a. (6.987, 8.013) b. (5.443, 9.561) c. (6.881, 8.129) d. (5.544, 9.468) 0000 e. We don't have enough information to compute CI. In the Rose Bowl, Illinois lost the turnover statistic and ended up losing the game. Sports commentators stress all the time that winning the turnover statistic leads to winning games and claim that this happens more than 90% of the time. You are interested in proving this claim so you randomly sample 46 games and find that in 42 of the 46 games, that when teams have a positive turnover statistic, they end up winning the game. What is the value of the appropriate test statistic for evaluating this claim? Select one: 0 a. 0.3140 0 b. 6.6667 0 c. 0.0130 0 d. 7.5571 0 e. 0.2949 Consider a normally distributed random variable X with mean 30 and standard deviation 10. You draw a random sample of size 100 from this distribution and obtain a mean of 33 and standard deviation of 9. What is the exact mean and standard deviation of the sampling distribution of -x (xbar)? Select one: O a. E( "x)=33, SD( "x)=0.9 O b. E( x)=9, SD( -x)=0.81 O c. E( x)=30, SD( x)=1 O d. E( x)=3, SD( x)=6You believe that the quality of the companies appearing on Shark Tank has increased over time. You obtain data on average sales for a random sample of 20 companies that appeared on the show in Season 6 and found that the average was $315,000 with a standard deviation of $40,000. You are told that the average sales for all companies appearing on Shark Tank in Season 1 was $300,000. Have average sales increased since Season'l. What is the appropriate null and alternative hypothesis? Select one: 0 a. H0:u= 315,000 vs.H1:u =315,000 b. H0:u= 315,000 vs.H1:u 300,000 d. H041: 315,000 vs.H1:|.1 >315,000 0000 e. H041: 300,000 VS.H1:u= 300,000 As a real estate agent in the Urbana-Champaign area, you have long made the claim that houses sold in Urbana (population 'I) are generally older than the houses sold in Champaign (population 2). You decide to check whether this claim is statistically valid and assume that the population variances are equali You collect a sample of ages of houses sold in the two cities, and find the following data: City Sample Size Average Age Standard Deviation Urbana 24 46 18 Champaign 35 42 16 What is the value of the test statistic for testing whether the average age of houses is equal in Urbana and Champaign? Select one: 0 a. 3.6784 0 b. 3.6815 0 c. 3.6407 0 d. 0.8965 0 e. 0.8768 Which of the following is not a measure of dispersion? Select one: Q a. Range 0 b. Median O c. Quartile deviation 0 d. Coefficient of variation ABC, a computer manufacturer claims that their ultra light notebook's battery can last 20 hours or less. After buying the notebook, you notice that the battery lasts more than 20 hours and you want to test their claim. You take a random sample of 50 notebooks and find that on average, the notebook battery lasts 22 hours. From consumer reports, you know that the population standard deviation is 5.2 hours. What sample size would be needed to form a 90% Confidence interval with a width of 0.6? Refer to the following critical values. 2001 = 2.326 20925 = 1.960 2005 = 1.645 201 = 1.282 to_o1'49 = 2.405 to_025'49 = 2.010 t0105'49 = 1.676 to_1,49 =1.299 Select one: Q a. n=203 O b. n=305 O c. n=503 Q d. n=945 You believe that the quality of the companies appearing on Shark Tank has increased over time. You obtain data on average sales for a random sample of 20 companies that appeared on the show in Season 6 and found that the average was $315,000 with a standard deviation of $40,000. You are told that the average sales for all companies appearing on Shark Tank in Season 1 was $300,000. Have average sales increased since Season1. What is the appropriate test shall we use? Select one: Q a. ztest b. z-test with degree of freedom 19 c. t-test with degree of freedom 20 d. t-test with degree of freedom 19 0000 e. none of above A congressional subcommittee considering regulation of the cable television industry investigates whether cable rates are higher, on average, in areas with no competition (population 1) than in areas with competition (population 2). They randomly sample the basic rates for six cable companies that have no competition and for six companies that face competition. Sample descriptive statistics are shown below. Assume that population variances are NOT equal. No Competition Competition Mean 24.14 Mean 20.88 Standard deviation 2.17 Standard deviation 3.36 What is the value of the test statistic for this hypothesis test Select one: 0 a. 0.653 O b. 1.996 O c. 3.357 0 d. 3.396 0 e. 1.223 Which of the following is true for a distribution that is skewed to the left? Select one: 0 a. Mean
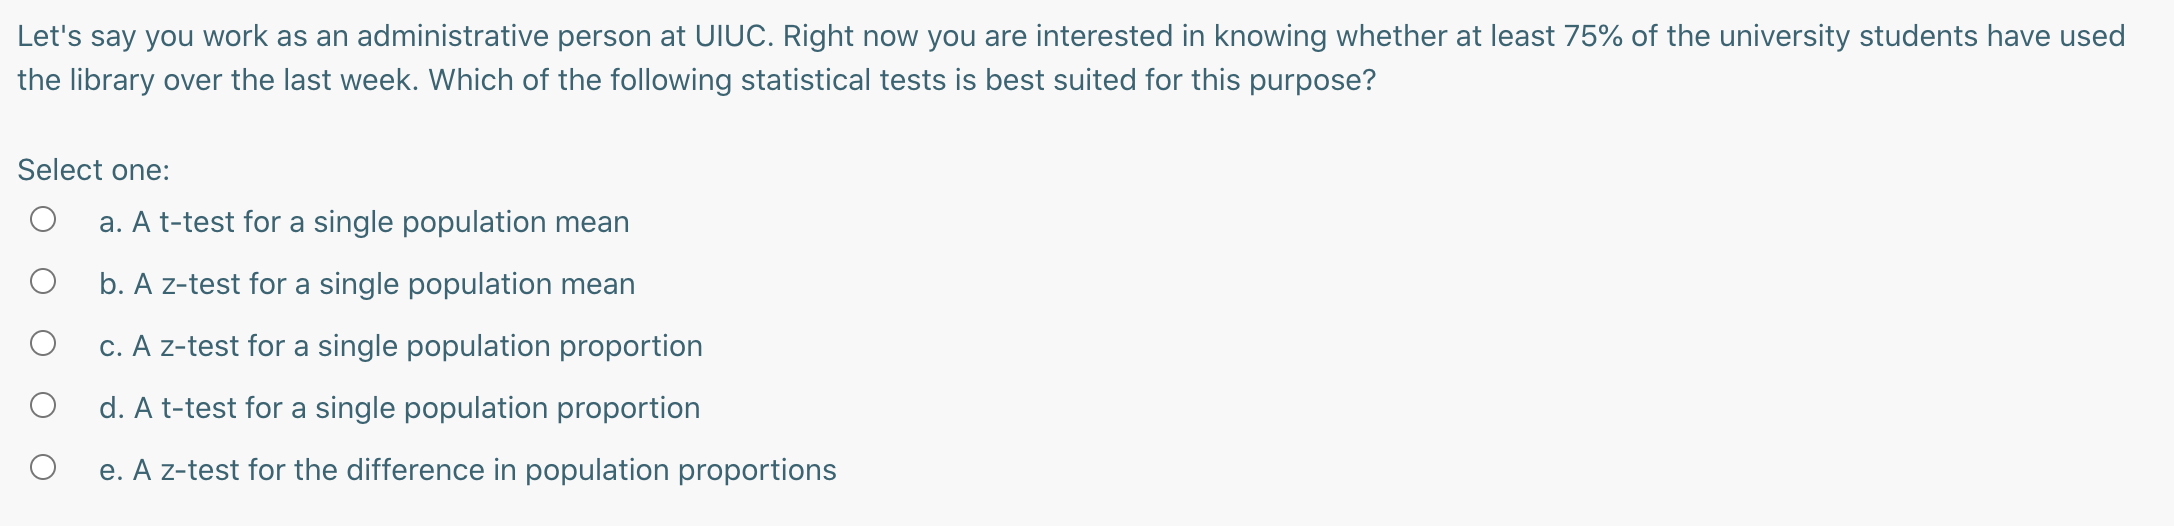
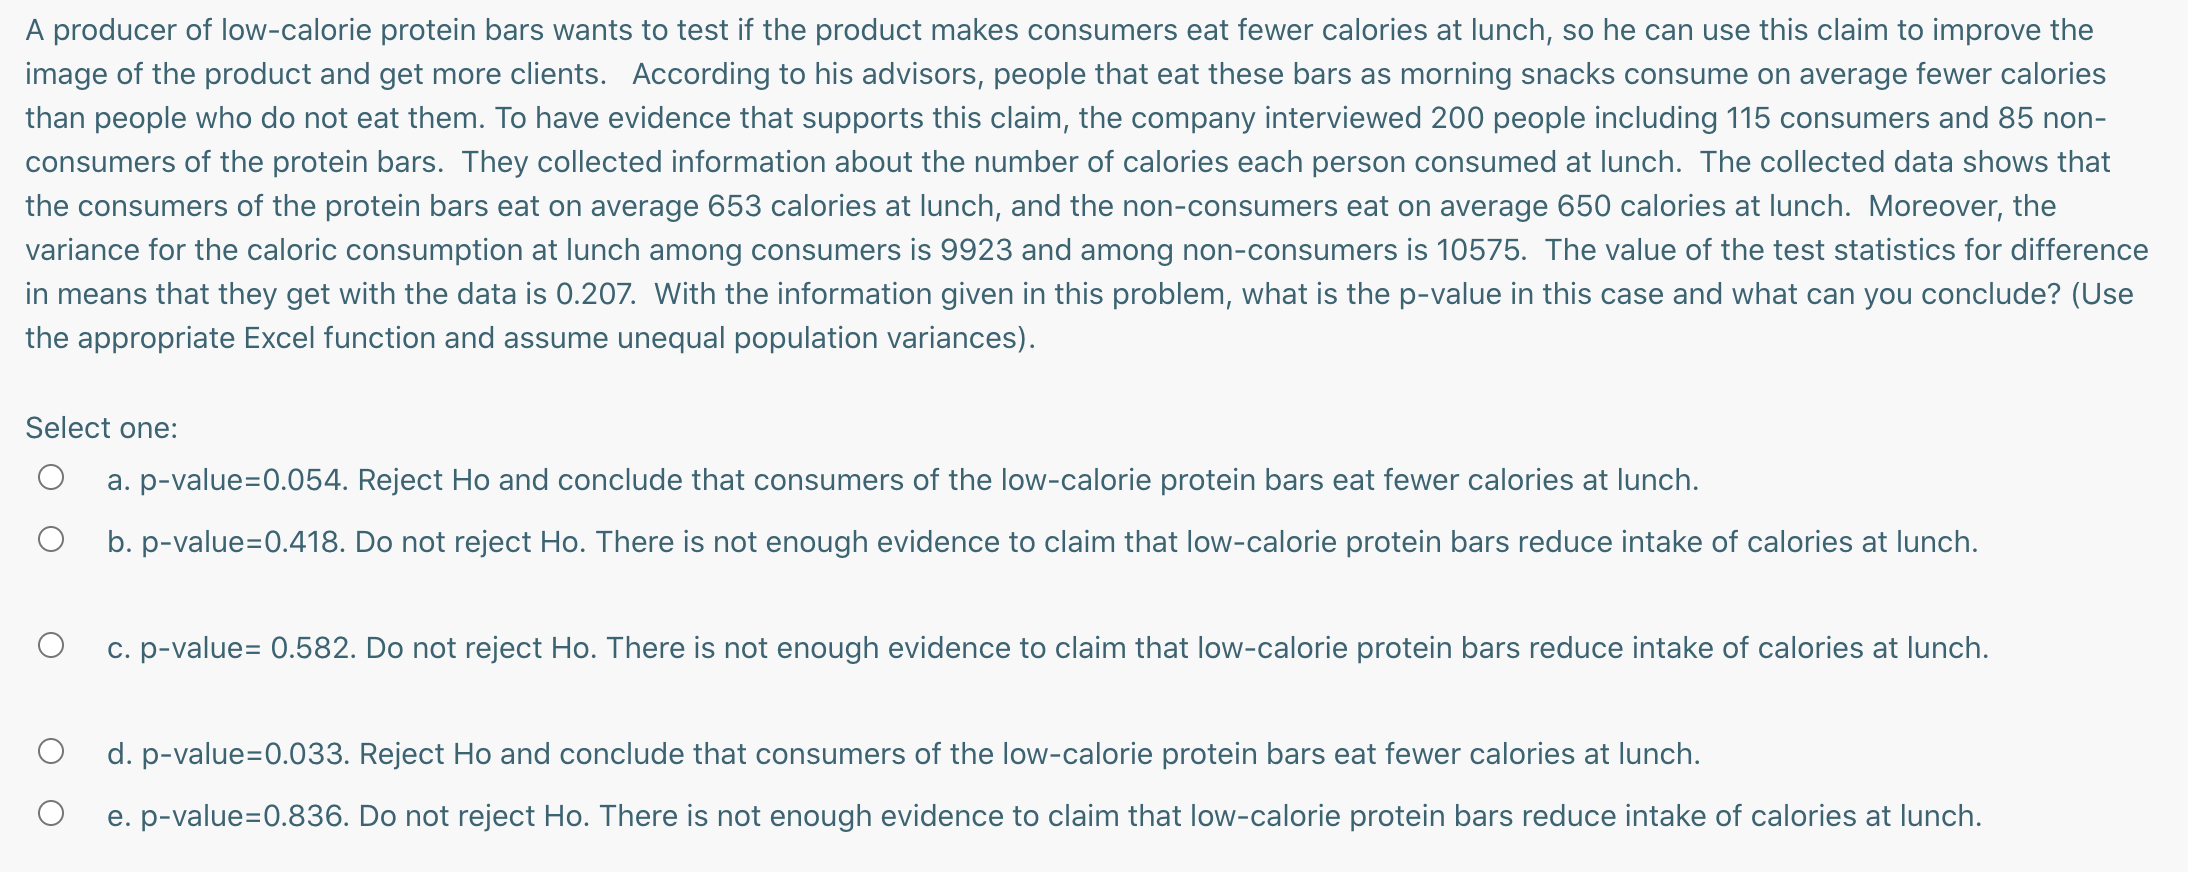
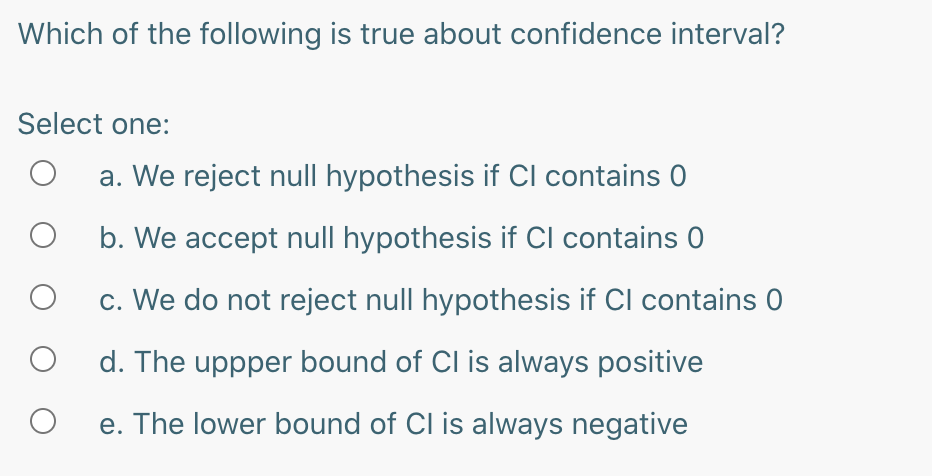
Median2Mode Let's say you work as an administrative person at UIUC. Right now you are interested in knowing whether at least 75% of the university students have used the library over the last week. Which of the following statistical tests is best suited for this purpose? Select one: Q a. A t-test for a single population mean b. A z-test for a single population mean c. A ztest for a single population proportion d. A t-test for a single population proportion 0000 e. A Z-test for the difference in population proportions A producer of low-calorie protein bars wants to test if the product makes consumers eat fewer calories at lunch, so he can use this claim to improve the image of the product and get more clients. According to his advisors, people that eat these bars as morning snacks consume on average fewer calories than people who do not eat them. To have evidence that supports this claim, the company interviewed 200 people including 115 consumers and 85 non- consumers of the protein bars. They collected information about the number of calories each person consumed at lunch. The collected data shows that the consumers of the protein bars eat on average 653 calories at lunch, and the non-consumers eat on average 650 calories at lunch. Moreover, the variance for the caloric consumption at lunch among consumers is 9923 and among non-consumers is 10575. The value of the test statistics for difference in means that they get with the data is 0.207. With the information given in this problem, what is the p-value in this case and what can you conclude? (Use the appropriate Excel function and assume unequal population variances). Select one: 0 a. p-value=0.054. Reject Ho and conclude that consumers of the low-calorie protein bars eat fewer calories at lunch. 0 b. p-value=0.418. Do not reject Ho. There is not enough evidence to claim that low-calorie protein bars reduce intake of calories at lunch. 0 c. p-value: 0.582. Do not reject Ho. There is not enough evidence to claim that low-calorie protein bars reduce intake of calories at lunch. 0 d. p-value=0.033. Reject Ho and conclude that consumers of the low-calorie protein bars eat fewer calories at lunch. 0 e. p-value=0.836. Do not reject Ho. There is not enough evidence to claim that low-calorie protein bars reduce intake of calories at lunch. Which of the following is true about confidence interval? Select one: O a. We reject null hypothesis if Cl contains 0 O b. We accept null hypothesis if Cl contains 0 O c. We do not reject null hypothesis if Cl contains 0 O d. The uppper bound of Cl is always positive O e. The lower bound of Cl is always negative