

Answered step by step
Verified Expert Solution
Question
1 Approved Answer
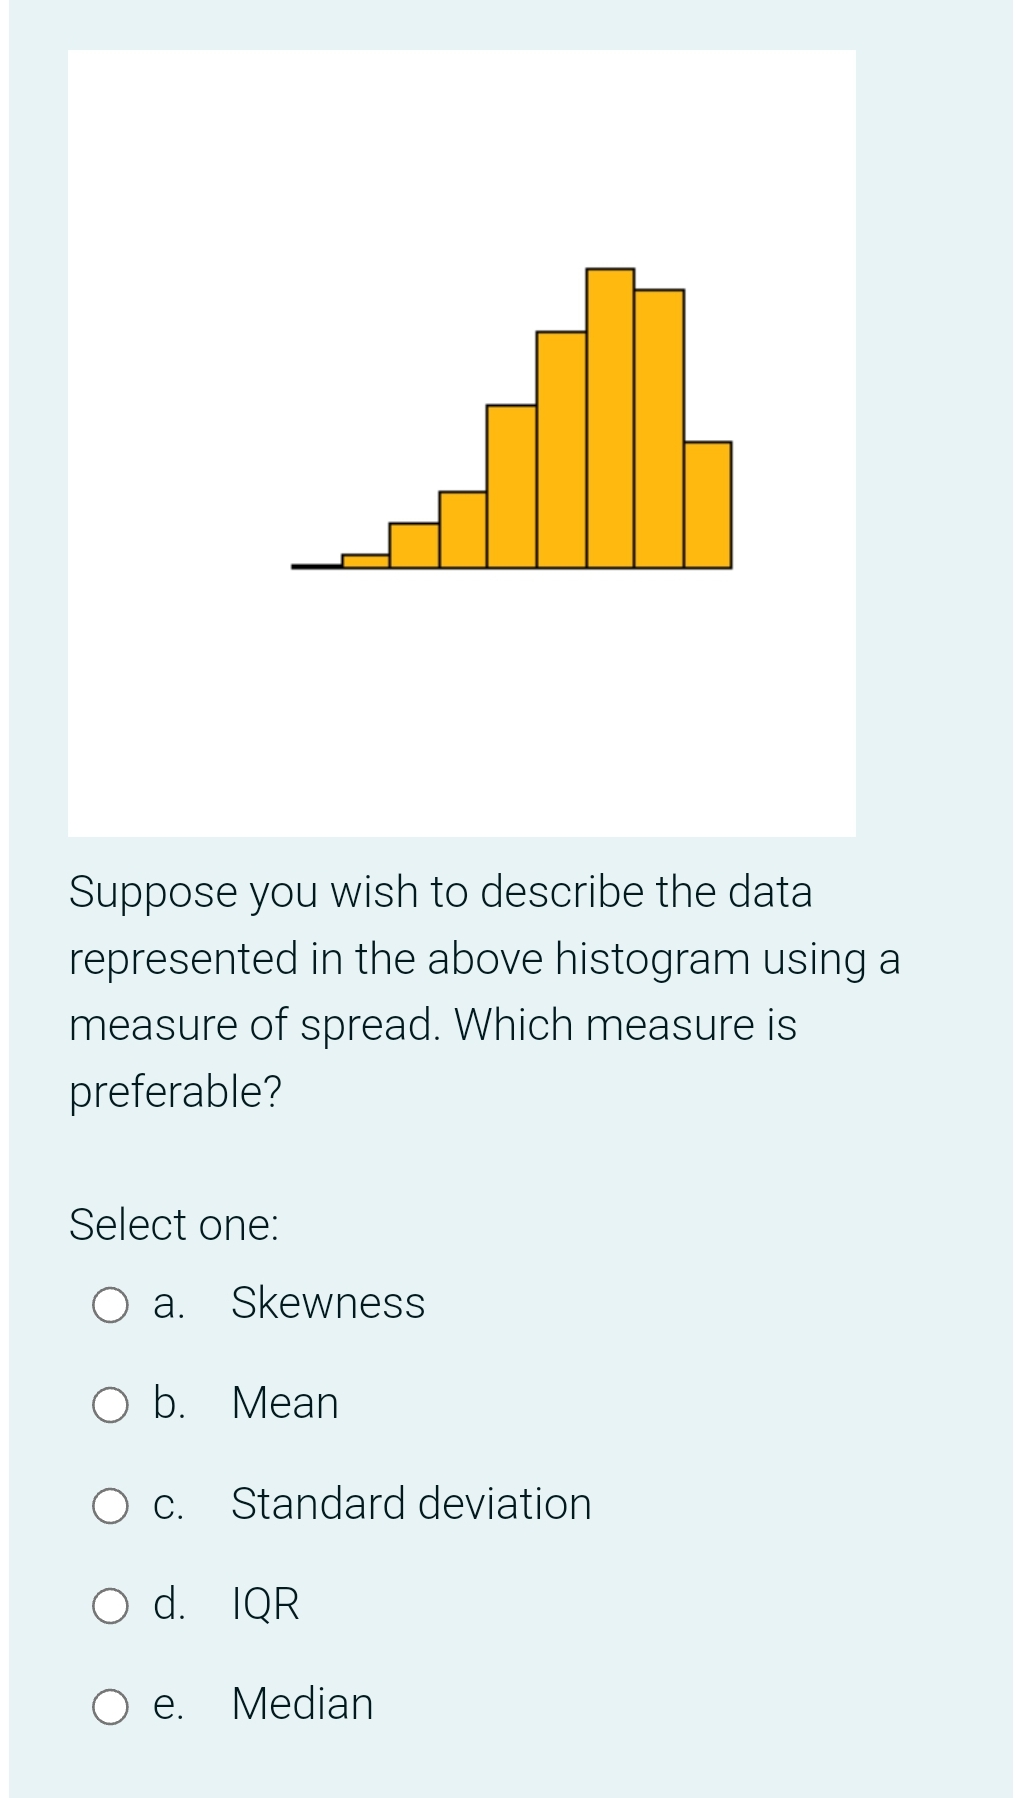
Suppose you wish to describe the data represented in the above histogram using a measure of spread. Which measure is preferable? Select one: 0 a.


Step by Step Solution
There are 3 Steps involved in it
Step: 1

Get Instant Access to Expert-Tailored Solutions
See step-by-step solutions with expert insights and AI powered tools for academic success
Step: 2

Step: 3
Ace Your Homework with AI
Get the answers you need in no time with our AI-driven, step-by-step assistance
Get Started
Graphical Approach To Precalculus With Limits A Unit Circle Approach, A
Authors: John E Hornsby, Margaret L Lial, Gary K Rockswold
5th Edition
0321899806, 9780321899804