

Question
syms s; R1 = 200*10^3; R2 = 40*10^3; R3 = 50*10^3; C1 = 25*10^(-9); C2 = 10*10^(-9); den = R1*((1/R1+ 1/R2 + 1/R3 + s*C1)*(s*R3*C2)
syms s;
R1 = 200*10^3; R2 = 40*10^3; R3 = 50*10^3;
C1 = 25*10^(-9); C2 = 10*10^(-9);
den = R1*((1/R1+ 1/R2 + 1/R3 + s*C1)*(s*R3*C2) + 1/R2); simplify(den) % % Result is: 100*s*((7555786372591433*s)/302231454903657293676544 + 1/20000) + 5
Simplify coefficient of s^2 a = 100*7555786372591433/302231454903657293676544 % Simplify coefficient of s b = 100/20000 % denG = [a, b, 5]; numG = -1;
Plot w = 1:10:10000; % % $$G(j\omega) = \frac{-1}{a\omega^2 - jb\omega + 5}$$ % Gs = -1./(a*w.^2 - j.*b.*w + 5); % semilogx(w, abs(Gs)) xlabel('Radian frequency w (rad/s') ylabel('|Vout/Vin|') title('Magnitude Vout/Vin vs. Radian Frequency') grid
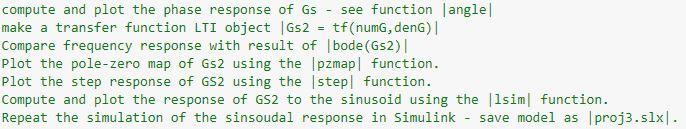
compute and plot the phase response of Gs - see function angle make a transfer function LTI object Gs2 = tf(numG, dent) Compare frequency response with result of [bode (Gs2) Plot the pole-zero map of Gs2 using the pzmap function. Plot the step response of GS2 using the step function. Compute and plot the response of GS2 to the sinusoid using the 1sim function. Repeat the simulation of the sinsoudal response in Simulink - save model as (proj3.slxlStep by Step Solution
There are 3 Steps involved in it
Step: 1

Get Instant Access to Expert-Tailored Solutions
See step-by-step solutions with expert insights and AI powered tools for academic success
Step: 2

Step: 3
Ace Your Homework with AI
Get the answers you need in no time with our AI-driven, step-by-step assistance
Get Started
Optimizing Database Performance Techniques To Optimize The Efficiency Of Database Systems And Applications
Authors: Craig S Mullins
1st Edition
B0CFZFD49Y, 979-8857641286