 System analysis using Matlab
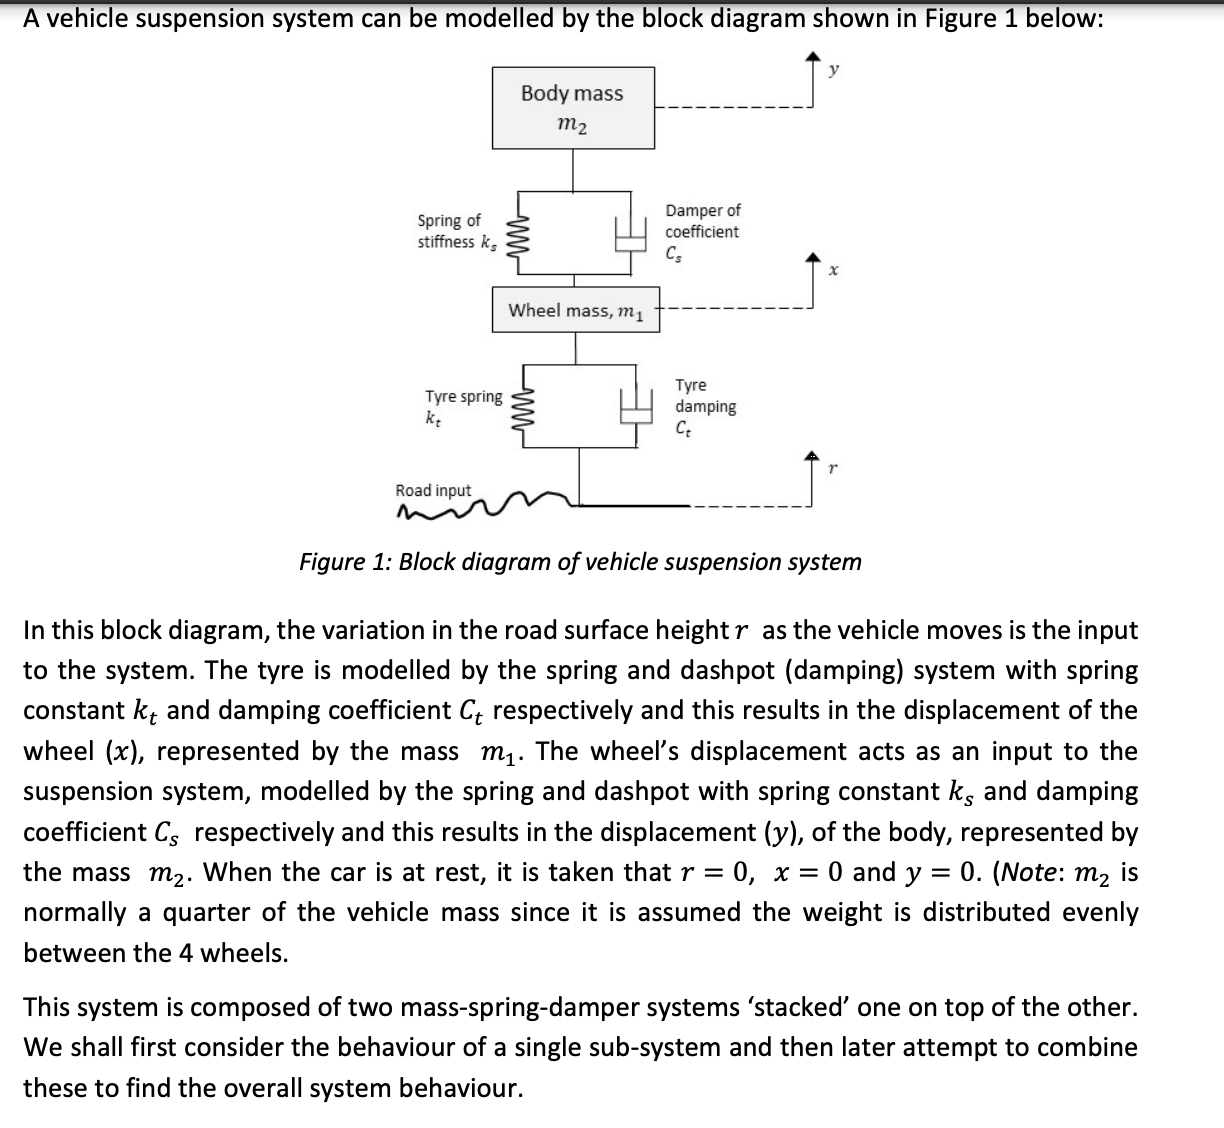
A vehicle suspension system can be modelled by the block diagram shown in Figure 1 below: Body mass m2 Spring of stiffness ks Damper of coefficient cs X Wheel mass, m1 Tyre spring kt Tyre damping Ct Road input 1 Figure 1: Block diagram of vehicle suspension system In this block diagram, the variation in the road surface height r as the vehicle moves is the input to the system. The tyre is modelled by the spring and dashpot (damping) system with spring constant kt and damping coefficient Ct respectively and this results in the displacement of the wheel (x), represented by the mass mi. The wheel's displacement acts as an input to the suspension system, modelled by the spring and dashpot with spring constant ks and damping coefficient Cs respectively and this results in the displacement (y), of the body, represented by the mass m2. When the car is at rest, it is taken that r = 0, x = 0 and y = 0. (Note: m2 is normally a quarter of the vehicle mass since it is assumed the weight is distributed evenly between the 4 wheels. This system is composed of two mass-spring-damper systems 'stacked' one on top of the other. We shall first consider the behaviour of a single sub-system and then later attempt to combine these to find the overall system behaviour. Using the commands given in the Guide, analyse the response of the suspension system using the m2 and ks parameters given in Section 1 and Cg value calculated in question 8. 9. Plot the impulse response and step response of the system (for 2 seconds duration and time 'step size' of 1 millisecond) using the impulse and step functions. Include all plots (properly labelled) in your submission. 10. Determine the frequency response from 0 to 200 rad/s using the freqs command. Plot the magnitude and phase response over this frequency range. Hint: Use frequency 'step size' of 0.1 rad/s. Hint 1: You can plot all 4 graphs in one go using a 2 x 2 matrix of plots using subplot(22n), where n determines which of the 4 subplots gets used. Hint 2: In order to clearly see variations over a range of frequencies, it is best to use a log scale for the frequency and magnitude (phase would still be displayed using linear scale). The functions loglog (for magnitude) and semilogx (for phase) can be used instead of plot. 11. Determine the magnitude response at Wn. Determine the frequency of the -3dB point (magnitude 1/V2 of passband). Hint: Use the 'data cursor tool on the plot of the magnitude response. It shows the x and y values of the plot as you move along the curve. 12. Discuss the response of the system. Why do the impulse and step responses have that particular shape? How well will this system fulfil its purpose of a vehicle suspension? Note: The function of a suspension system is to 'filter out the effect of bumps, potholes and other such road surface irregularities, but allow the vehicle to 'follow the road' as the height of the road surface varies. 13. Repeat the analysis above (steps 9 11) for the following damping ratios a. ? = 0.4 b. 3 = 0.7 C. 3 = 1.5 d. 3 = 2.0 Hint 3: It would be more efficient to put all the necessary commands into a script file (a .m file) so you can edit the parameters and then run all the commands at once. 14. Based on the results of the Matlab analysis above, which of the 5 values of damping ratio would be best for application as a suspension system. Justify your selection. A vehicle suspension system can be modelled by the block diagram shown in Figure 1 below: Body mass m2 Spring of stiffness ks Damper of coefficient cs X Wheel mass, m1 Tyre spring kt Tyre damping Ct Road input 1 Figure 1: Block diagram of vehicle suspension system In this block diagram, the variation in the road surface height r as the vehicle moves is the input to the system. The tyre is modelled by the spring and dashpot (damping) system with spring constant kt and damping coefficient Ct respectively and this results in the displacement of the wheel (x), represented by the mass mi. The wheel's displacement acts as an input to the suspension system, modelled by the spring and dashpot with spring constant ks and damping coefficient Cs respectively and this results in the displacement (y), of the body, represented by the mass m2. When the car is at rest, it is taken that r = 0, x = 0 and y = 0. (Note: m2 is normally a quarter of the vehicle mass since it is assumed the weight is distributed evenly between the 4 wheels. This system is composed of two mass-spring-damper systems 'stacked' one on top of the other. We shall first consider the behaviour of a single sub-system and then later attempt to combine these to find the overall system behaviour. Using the commands given in the Guide, analyse the response of the suspension system using the m2 and ks parameters given in Section 1 and Cg value calculated in question 8. 9. Plot the impulse response and step response of the system (for 2 seconds duration and time 'step size' of 1 millisecond) using the impulse and step functions. Include all plots (properly labelled) in your submission. 10. Determine the frequency response from 0 to 200 rad/s using the freqs command. Plot the magnitude and phase response over this frequency range. Hint: Use frequency 'step size' of 0.1 rad/s. Hint 1: You can plot all 4 graphs in one go using a 2 x 2 matrix of plots using subplot(22n), where n determines which of the 4 subplots gets used. Hint 2: In order to clearly see variations over a range of frequencies, it is best to use a log scale for the frequency and magnitude (phase would still be displayed using linear scale). The functions loglog (for magnitude) and semilogx (for phase) can be used instead of plot. 11. Determine the magnitude response at Wn. Determine the frequency of the -3dB point (magnitude 1/V2 of passband). Hint: Use the 'data cursor tool on the plot of the magnitude response. It shows the x and y values of the plot as you move along the curve. 12. Discuss the response of the system. Why do the impulse and step responses have that particular shape? How well will this system fulfil its purpose of a vehicle suspension? Note: The function of a suspension system is to 'filter out the effect of bumps, potholes and other such road surface irregularities, but allow the vehicle to 'follow the road' as the height of the road surface varies. 13. Repeat the analysis above (steps 9 11) for the following damping ratios a. ? = 0.4 b. 3 = 0.7 C. 3 = 1.5 d. 3 = 2.0 Hint 3: It would be more efficient to put all the necessary commands into a script file (a .m file) so you can edit the parameters and then run all the commands at once. 14. Based on the results of the Matlab analysis above, which of the 5 values of damping ratio would be best for application as a suspension system. Justify your selection

 System analysis using Matlab


