Answered step by step
Verified Expert Solution
Question
1 Approved Answer
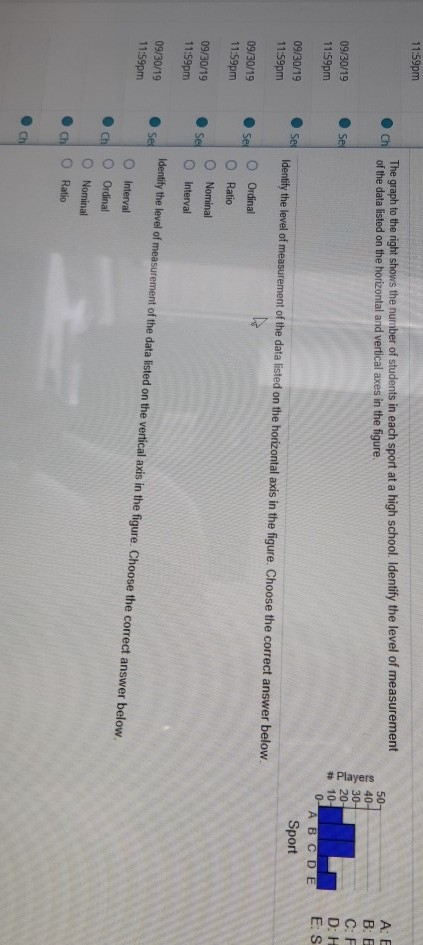
t 11:59pm The graph to the right shows the number of students in each sport at a high school. Identify the level of measurement of
t

11:59pm The graph to the right shows the number of students in each sport at a high school. Identify the level of measurement of the data listed on the horizontal and vertical axes in the figure. A: E #Players Se 09/30/19 11:59pm D: E: S ABCDE Sport SCA 09/30/19 11:59pm Identify the level of measurement of the data listed on the horizontal axis in the figure. Choose the correct answer below. 09/30/19 11:59pm O O O O Ordinal Ratio Nominal Interval 09/30/19 11:59pm Identify the level of measurement of the data listed on the vertical axis in the figure. Choose the correct answer below. 09/30/19 11:59pm OOOO Interval Ordinal Nominal ch0 Ratio 11:59pm The graph to the right shows the number of students in each sport at a high school. Identify the level of measurement of the data listed on the horizontal and vertical axes in the figure. A: E #Players Se 09/30/19 11:59pm D: E: S ABCDE Sport SCA 09/30/19 11:59pm Identify the level of measurement of the data listed on the horizontal axis in the figure. Choose the correct answer below. 09/30/19 11:59pm O O O O Ordinal Ratio Nominal Interval 09/30/19 11:59pm Identify the level of measurement of the data listed on the vertical axis in the figure. Choose the correct answer below. 09/30/19 11:59pm OOOO Interval Ordinal Nominal ch0 Ratio
Step by Step Solution
There are 3 Steps involved in it
Step: 1

Get Instant Access to Expert-Tailored Solutions
See step-by-step solutions with expert insights and AI powered tools for academic success
Step: 2

Step: 3

Ace Your Homework with AI
Get the answers you need in no time with our AI-driven, step-by-step assistance
Get Started


