Answered step by step
Verified Expert Solution
Link Copied!

Question

1 Approved Answer

t Answer Portfolio Changes April 2018 (8 points) In April 2015, an investor invested $10,000 in each of the 8 stocks listed in Table 1.
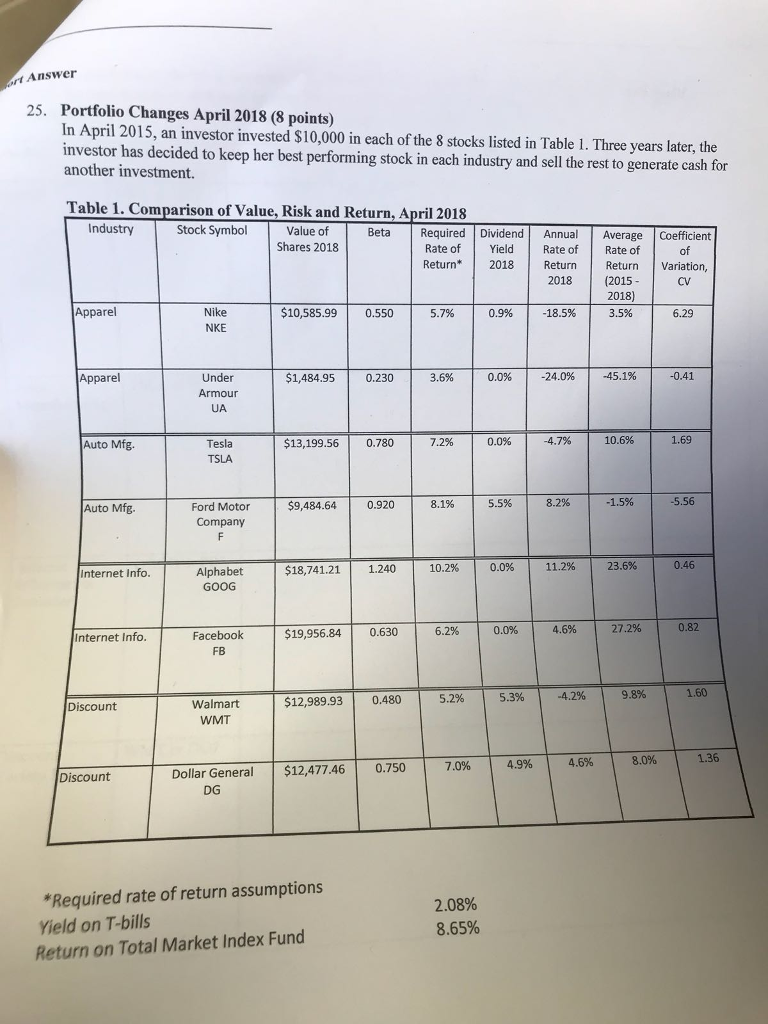
image text in transcribedimage text in transcribed

t Answer Portfolio Changes April 2018 (8 points) In April 2015, an investor invested $10,000 in each of the 8 stocks listed in Table 1. Three years later, the investor has decided to keep her best performing stock in each industry and sell the rest to generate cash for another investment. 25. Table 1. Comparison of Value, Risk and Return, April 2018 Industry Stock SymbolValue of Beta Required DividendAnnu Average Coefficient Shares 2018 Rate of Yield Rate of Rate of Return 2018 Return Return Variation, of 2018 (2015CV 2018) Apparel Nike NKE $10,585.99 | 0.550 | 5.7% | 0.9% | -18.5% | 3.5% | 6.29 Under Armour UA Appare $1,484.950.230 3.6% 0.0% | -24.0% | -45.1% 0.41 Tesla TSLA $13,199.56 0.780 0.0% 10.6% 1.69 Auto Mfg. 72% Auto Mfg. Ford Motor Company $9,484.64 0.920 8.1% 5.5% 8.2% 1.5% 5.56 $18,741.21 1.240 10.2% 0.0% 11.2% 23.6% 0.46 Alphabet GOOG Internet Info. $19,956.84 0.630 6.2% 0.0% 4.6% 27.2% 0.82 Facebook FB Internet Info. 5.2% 5.3% 4.2% 9.8% 1.60 $12,989.93 0.480 Walmart WMT Discount 8.0% 1.36 70% 4.9% 4.6% Discount Dollar General $12,477.46 0.750 DG Required rate of return assumptions Yield on T-bills Return on Total Market Index Fund 2.08% 8.65%

Step by Step Solution

There are 3 Steps involved in it

Step: 1

blur-text-image

Get Instant Access to Expert-Tailored Solutions

See step-by-step solutions with expert insights and AI powered tools for academic success

Step: 2

blur-text-image_step_2

Step: 3

blur-text-image_step3

Ace Your Homework with AI

Get the answers you need in no time with our AI-driven, step-by-step assistance

Get Started

Recommended Textbook for

More Books

Students also viewed these Finance questions