

Answered step by step
Verified Expert Solution
Question
1 Approved Answer
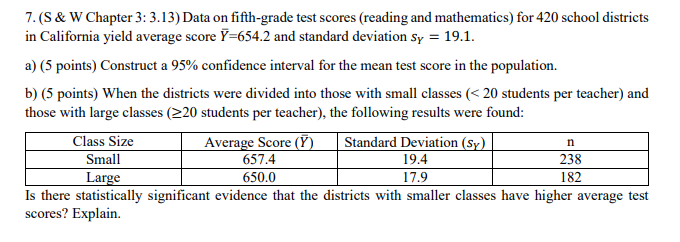
T. {S 62: W Chapter 3: 3. ll} Data on h grade test scores {reading and mathematics] for 421'] school districts in California yield average
Step by Step Solution
There are 3 Steps involved in it
Step: 1

Get Instant Access to Expert-Tailored Solutions
See step-by-step solutions with expert insights and AI powered tools for academic success
Step: 2

Step: 3
Ace Your Homework with AI
Get the answers you need in no time with our AI-driven, step-by-step assistance
Get Started
Managerial Economics A Problem-Solving Approach
Authors: Luke M. Froeb, Brain T. Mccann
2nd Edition
B00BTM8FK0