

Question
tab EducationLevel rs highest | degree | Freq. Percent Cum. ---------------+----------------------------------- high school | 1,461 57.50 57.50 junior college | 226 8.89 66.39 bachelor |
tab EducationLevel
rs highest |
degree | Freq. Percent Cum.
---------------+-----------------------------------
high school | 1,461 57.50 57.50
junior college | 226 8.89 66.39
bachelor | 536 21.09 87.49
graduate | 318 12.51 100.00
---------------+-----------------------------------
Total | 2,541 100.00
Using the information provided please solve all parts of the question to receive a good review. Thankyou so much!
tab Gender MisusePresc
GENDER - | RC-PAIN RELIEVERS -
IMPUTATION | EVER MISUSED
REVISED | 0 - Never 1 - Ever | Total
-----------+----------------------+----------
1 - Male | 23,515 3,221 | 26,736
2 - Female | 27,288 3,122 | 30,410
-----------+----------------------+----------
Total | 50,803 6,343 | 57,146
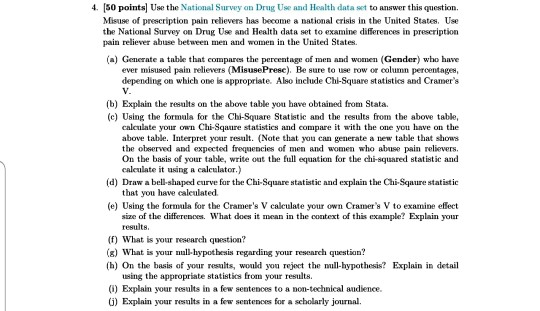
4. (50 points Use the National Survey on Drug Use and Health data set to answer this question, Misuse of prescription pain relievers has become a national crisis in the United States. Use the National Survey on Drug Use and Health data set to examine differences in prescription pain reliever abuse between men and women in the United States. (a) Generate a table that compares the percentage of men and women (Gender) who have ever misused pain relievers (Misuse Prese). Be sure to use row or column percentages, depending on which one is appropriate. Also include Chi-Square statistics and Cramer's V. (b) Explain the results on the above table you have obtained from Stata. (c) Using the formula for the Chi-Square Statistic and the results from the above table, calculate your own Chi-Sqaure statistics and compare it with the one you have on the above table. Interpret your result. (Note that you can generate a new table that shows the observed and expected frequencies of men and women who abuse prin relievers. On the basis of your table, write out the full equation for the chi-squared statistic and calculate it using a calculator) (d) Draw a bell-shaped curve for the Chi-Square statistic and explain the Chi-Sqaure statistic that you have caleulated. (e) Using the formula for the Cramer's V calculate your own Cramer's V to examine effect size of the differences. What does it mean in the context of this example? Explain your results (f) What is your research question? (8) What is your null-hypothesis regarding your research question? (h) On the basis of your results, would you reject the mill-hypothesis? Explain in detail using the appropriate statistics from your results. (1) Explain your results in a few sentences to a non-technical audience. G) Explain your results in a few sentences for a scholarly journal. 4. (50 points Use the National Survey on Drug Use and Health data set to answer this question, Misuse of prescription pain relievers has become a national crisis in the United States. Use the National Survey on Drug Use and Health data set to examine differences in prescription pain reliever abuse between men and women in the United States. (a) Generate a table that compares the percentage of men and women (Gender) who have ever misused pain relievers (Misuse Prese). Be sure to use row or column percentages, depending on which one is appropriate. Also include Chi-Square statistics and Cramer's V. (b) Explain the results on the above table you have obtained from Stata. (c) Using the formula for the Chi-Square Statistic and the results from the above table, calculate your own Chi-Sqaure statistics and compare it with the one you have on the above table. Interpret your result. (Note that you can generate a new table that shows the observed and expected frequencies of men and women who abuse prin relievers. On the basis of your table, write out the full equation for the chi-squared statistic and calculate it using a calculator) (d) Draw a bell-shaped curve for the Chi-Square statistic and explain the Chi-Sqaure statistic that you have caleulated. (e) Using the formula for the Cramer's V calculate your own Cramer's V to examine effect size of the differences. What does it mean in the context of this example? Explain your results (f) What is your research question? (8) What is your null-hypothesis regarding your research question? (h) On the basis of your results, would you reject the mill-hypothesis? Explain in detail using the appropriate statistics from your results. (1) Explain your results in a few sentences to a non-technical audience. G) Explain your results in a few sentences for a scholarly journalStep by Step Solution
There are 3 Steps involved in it
Step: 1

Get Instant Access to Expert-Tailored Solutions
See step-by-step solutions with expert insights and AI powered tools for academic success
Step: 2

Step: 3
Ace Your Homework with AI
Get the answers you need in no time with our AI-driven, step-by-step assistance
Get Started
Corporate Financial Reporting And Analysis A Global Perspective
Authors: S. David Young, Jacob Cohen, Daniel A. Bens
4th Edition
1119494575, 978-1119494577