Answered step by step
Verified Expert Solution
Question
1 Approved Answer
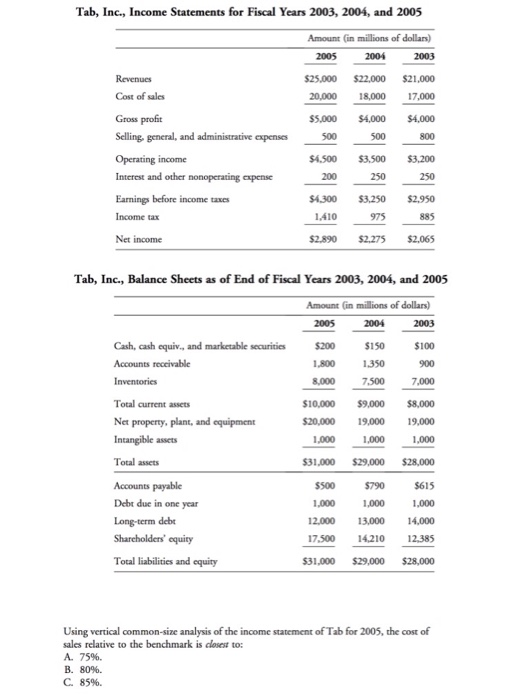
Tab, Inc., Income Statements for Fiscal Years 2003, 2004, and 2005 Amount in millions of dollars) 2005 2004 2003 Revenues Cost of sales $25.000 20,000
Step by Step Solution
There are 3 Steps involved in it
Step: 1

Get Instant Access to Expert-Tailored Solutions
See step-by-step solutions with expert insights and AI powered tools for academic success
Step: 2

Step: 3
Ace Your Homework with AI
Get the answers you need in no time with our AI-driven, step-by-step assistance
Get Started