Answered step by step
Verified Expert Solution
Question
1 Approved Answer
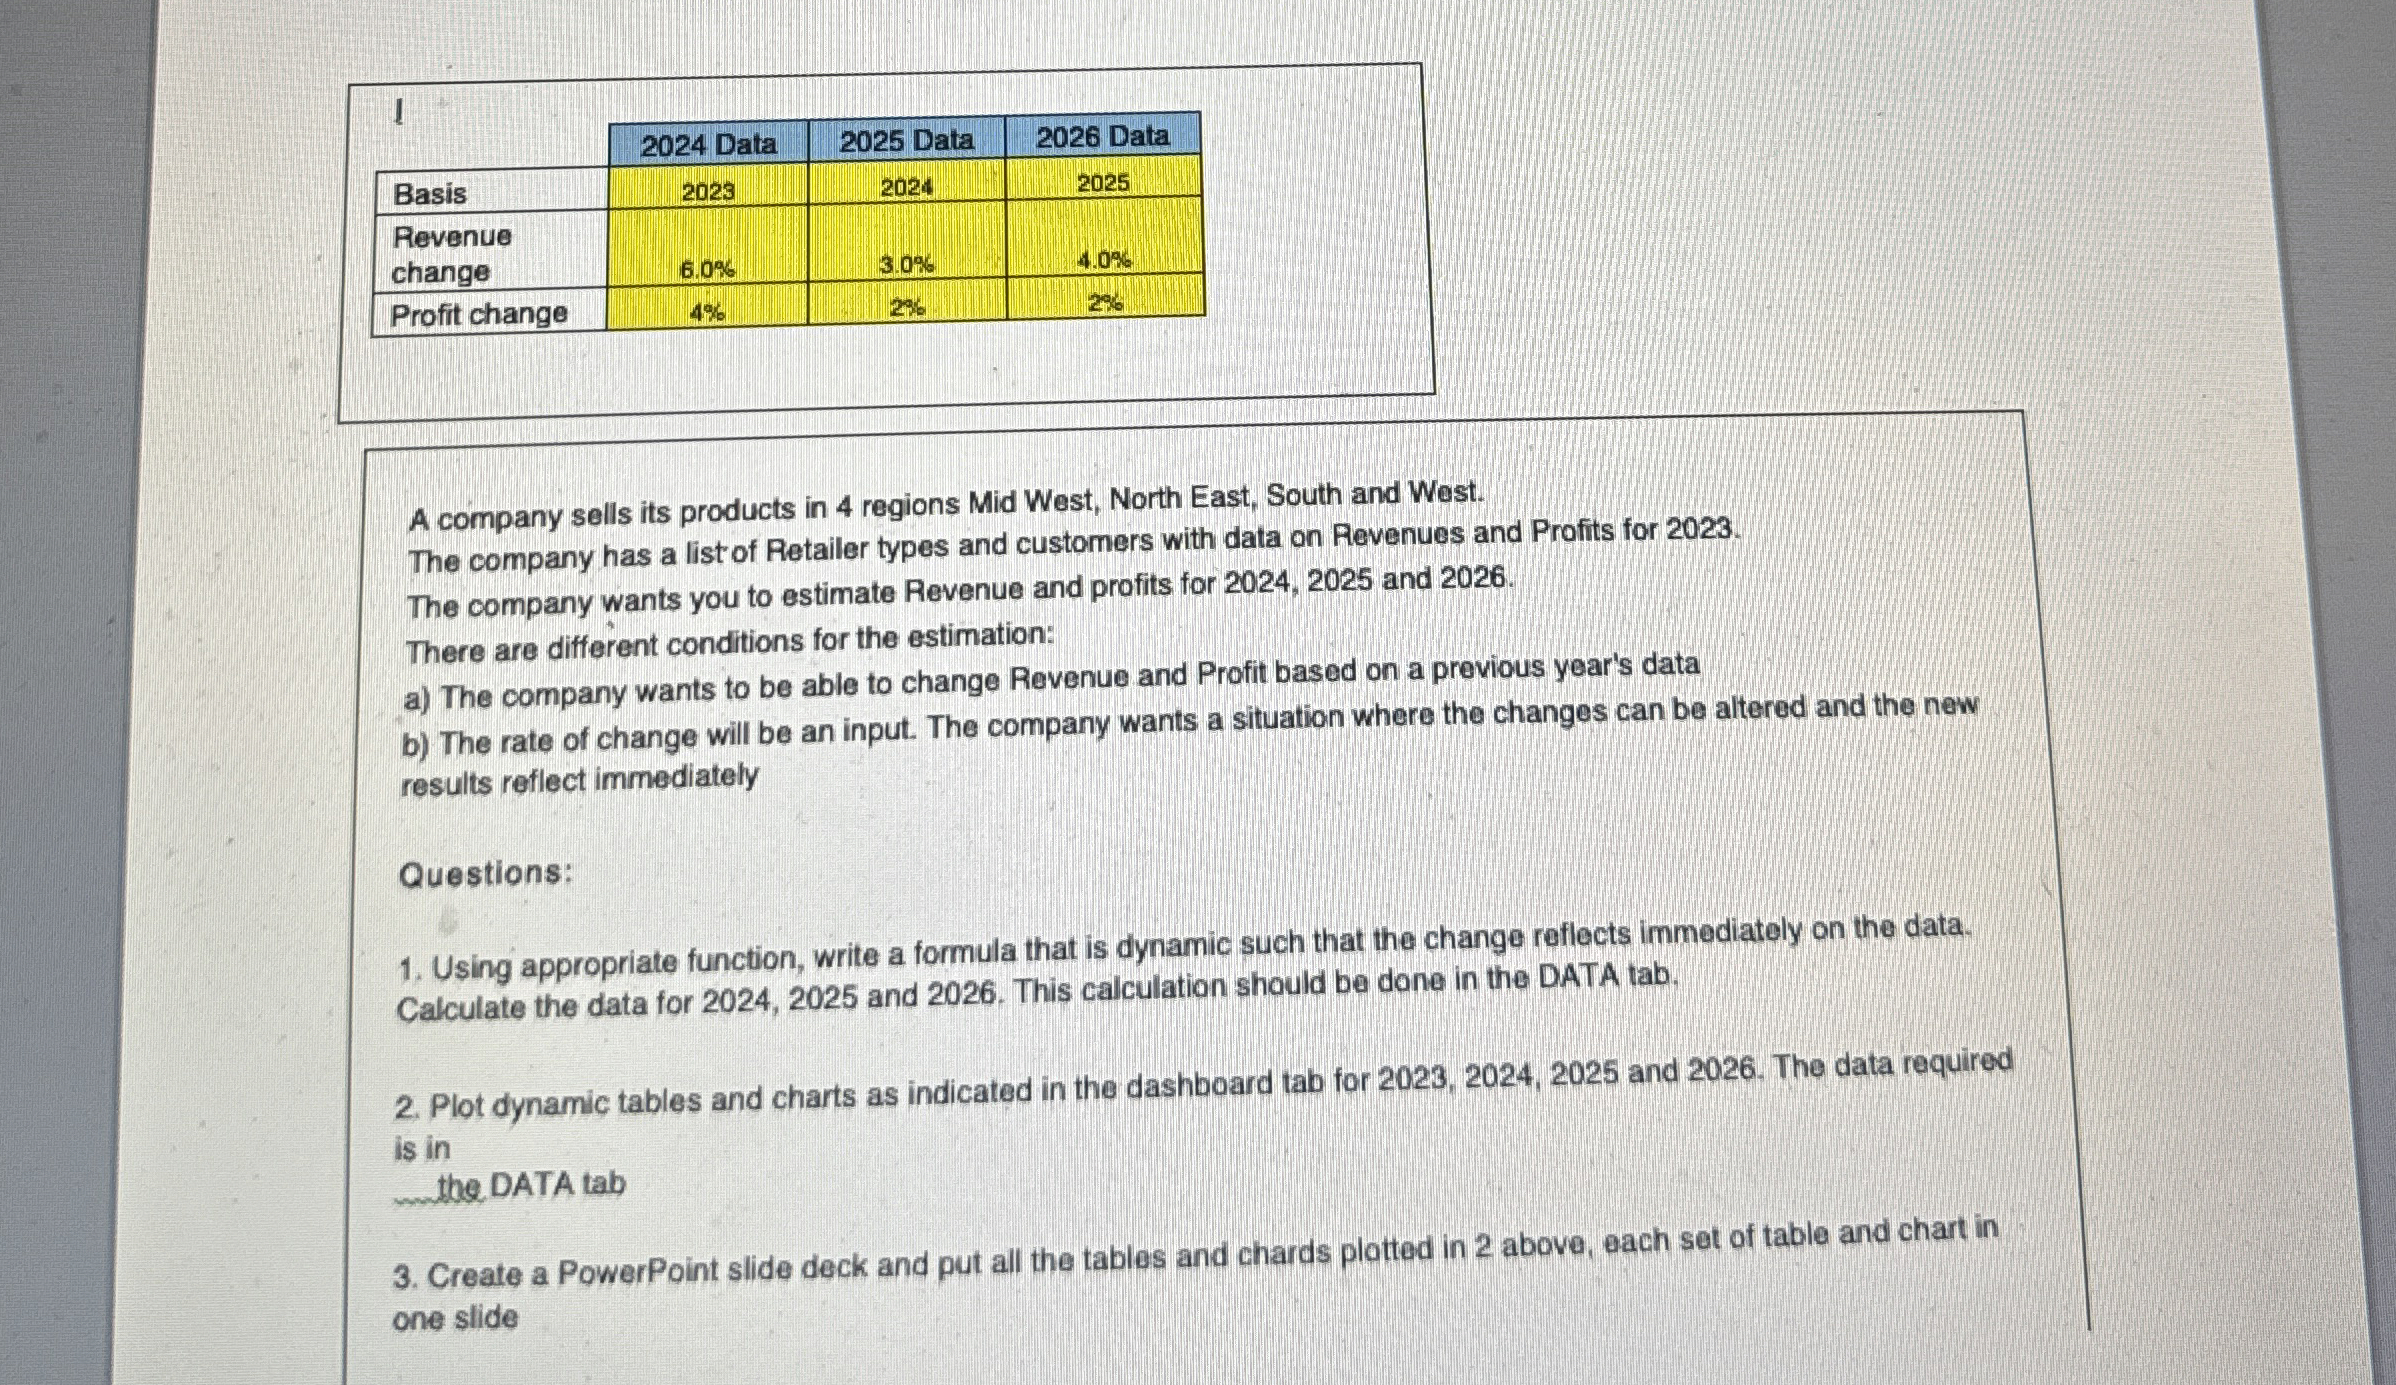
table [ [ 1 , ] , [ , 2 0 2 4 Data, 2 0 2 5 Data, 2 0 2 6 Data,
table Data, Data, Data,BasistableRevenuechangeProfit change,
A company sells its products in regions Mid West, North East, South and West.
The company has a list of Retailer types and customers with data on Revenues and Profits for
The company wants you to estimate Revenue and profits for and
There are different conditions for the estimation:
a The company wants to be able to change Revenue and Profit based on a previous year's data
b The rate of change will be an input. The company wants a situation where the changes can be altered and the new results reflect immediately
Questions:
Using appropriate function, write a formula that is dynamic such that the change reflects immediately on the data. Calculate the data for and This calculation should be done in the DATA tab.
Plot dynamic tables and charts as indicated in the dashboard tab for and The data required is in the. DATA tab
Create a PowerPoint slide deck and put all the tables and chards plotted in above, each set of table and chart in one slide

Step by Step Solution
There are 3 Steps involved in it
Step: 1

Get Instant Access to Expert-Tailored Solutions
See step-by-step solutions with expert insights and AI powered tools for academic success
Step: 2

Step: 3

Ace Your Homework with AI
Get the answers you need in no time with our AI-driven, step-by-step assistance
Get Started


