Answered step by step
Verified Expert Solution
Question
1 Approved Answer
Table 1 and Figure 1 depict certain financial ratios and stock quotes on Moderna Inc. that were retrieved from Yahoo! Finance. Table 1: Financial Ratios
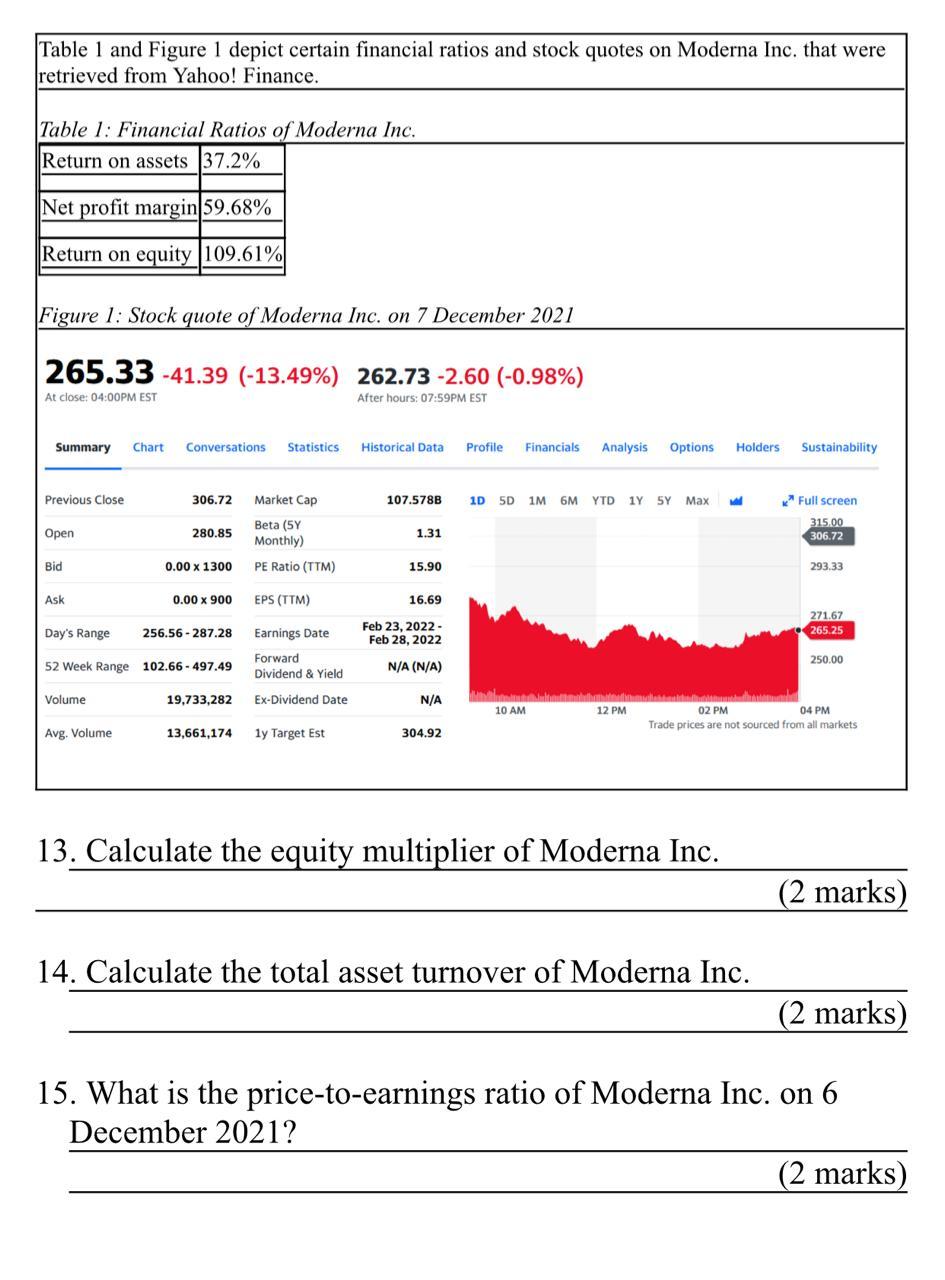
Table 1 and Figure 1 depict certain financial ratios and stock quotes on Moderna Inc. that were retrieved from Yahoo! Finance. Table 1: Financial Ratios of Moderna Inc. Return on assets 37.2% Net profit margin 59.68% Return on equity 109.61% Figure 1: Stock quote of Moderna Inc. on 7 December 2021 265.33 -41.39 (-13.49%) 262.73 -2.60 (-0.98%) At close: 04:00PM EST After hours: 07:59PM EST Summary Chart Conversations Statistics Historical Data Profile Financials Analysis Options Holders Sustainability Previous Close 306.72 107.578B 1D SD 1M 6M YTD 1Y SY Max Market Cap Beta (5Y Monthly) * Full screen 315.00 306.72 Open 280.85 1.31 Bid 0.00 x 1300 PE Ratio (TTM) 15.90 293.33 Ask 0.00 x 900 EPS (TTM) 16.69 271.67 265.25 Day's Range Feb 23, 2022- Feb 28, 2022 256.56 - 287.28 Earnings Date Forward Dividend & Yield 250.00 52 Week Range 102.66 - 497.49 N/A (N/A) Volume 19,733,282 Ex-Dividend Date N/A 10 AM 12 PM 02 PM 04 PM Trade prices are not sourced from all markets Avg. Volume 13,661,174 1y Target Est 304.92 13. Calculate the equity multiplier of Moderna Inc. (2 marks) 14. Calculate the total asset turnover of Moderna Inc. (2 marks) 15. What is the price-to-earnings ratio of Moderna Inc. on 6 December 2021? (2 marks)
Step by Step Solution
There are 3 Steps involved in it
Step: 1
Get Instant Access to Expert-Tailored Solutions
See step-by-step solutions with expert insights and AI powered tools for academic success
Step: 2
Step: 3
Ace Your Homework with AI
Get the answers you need in no time with our AI-driven, step-by-step assistance
Get Started