Answered step by step
Verified Expert Solution
Question
1 Approved Answer
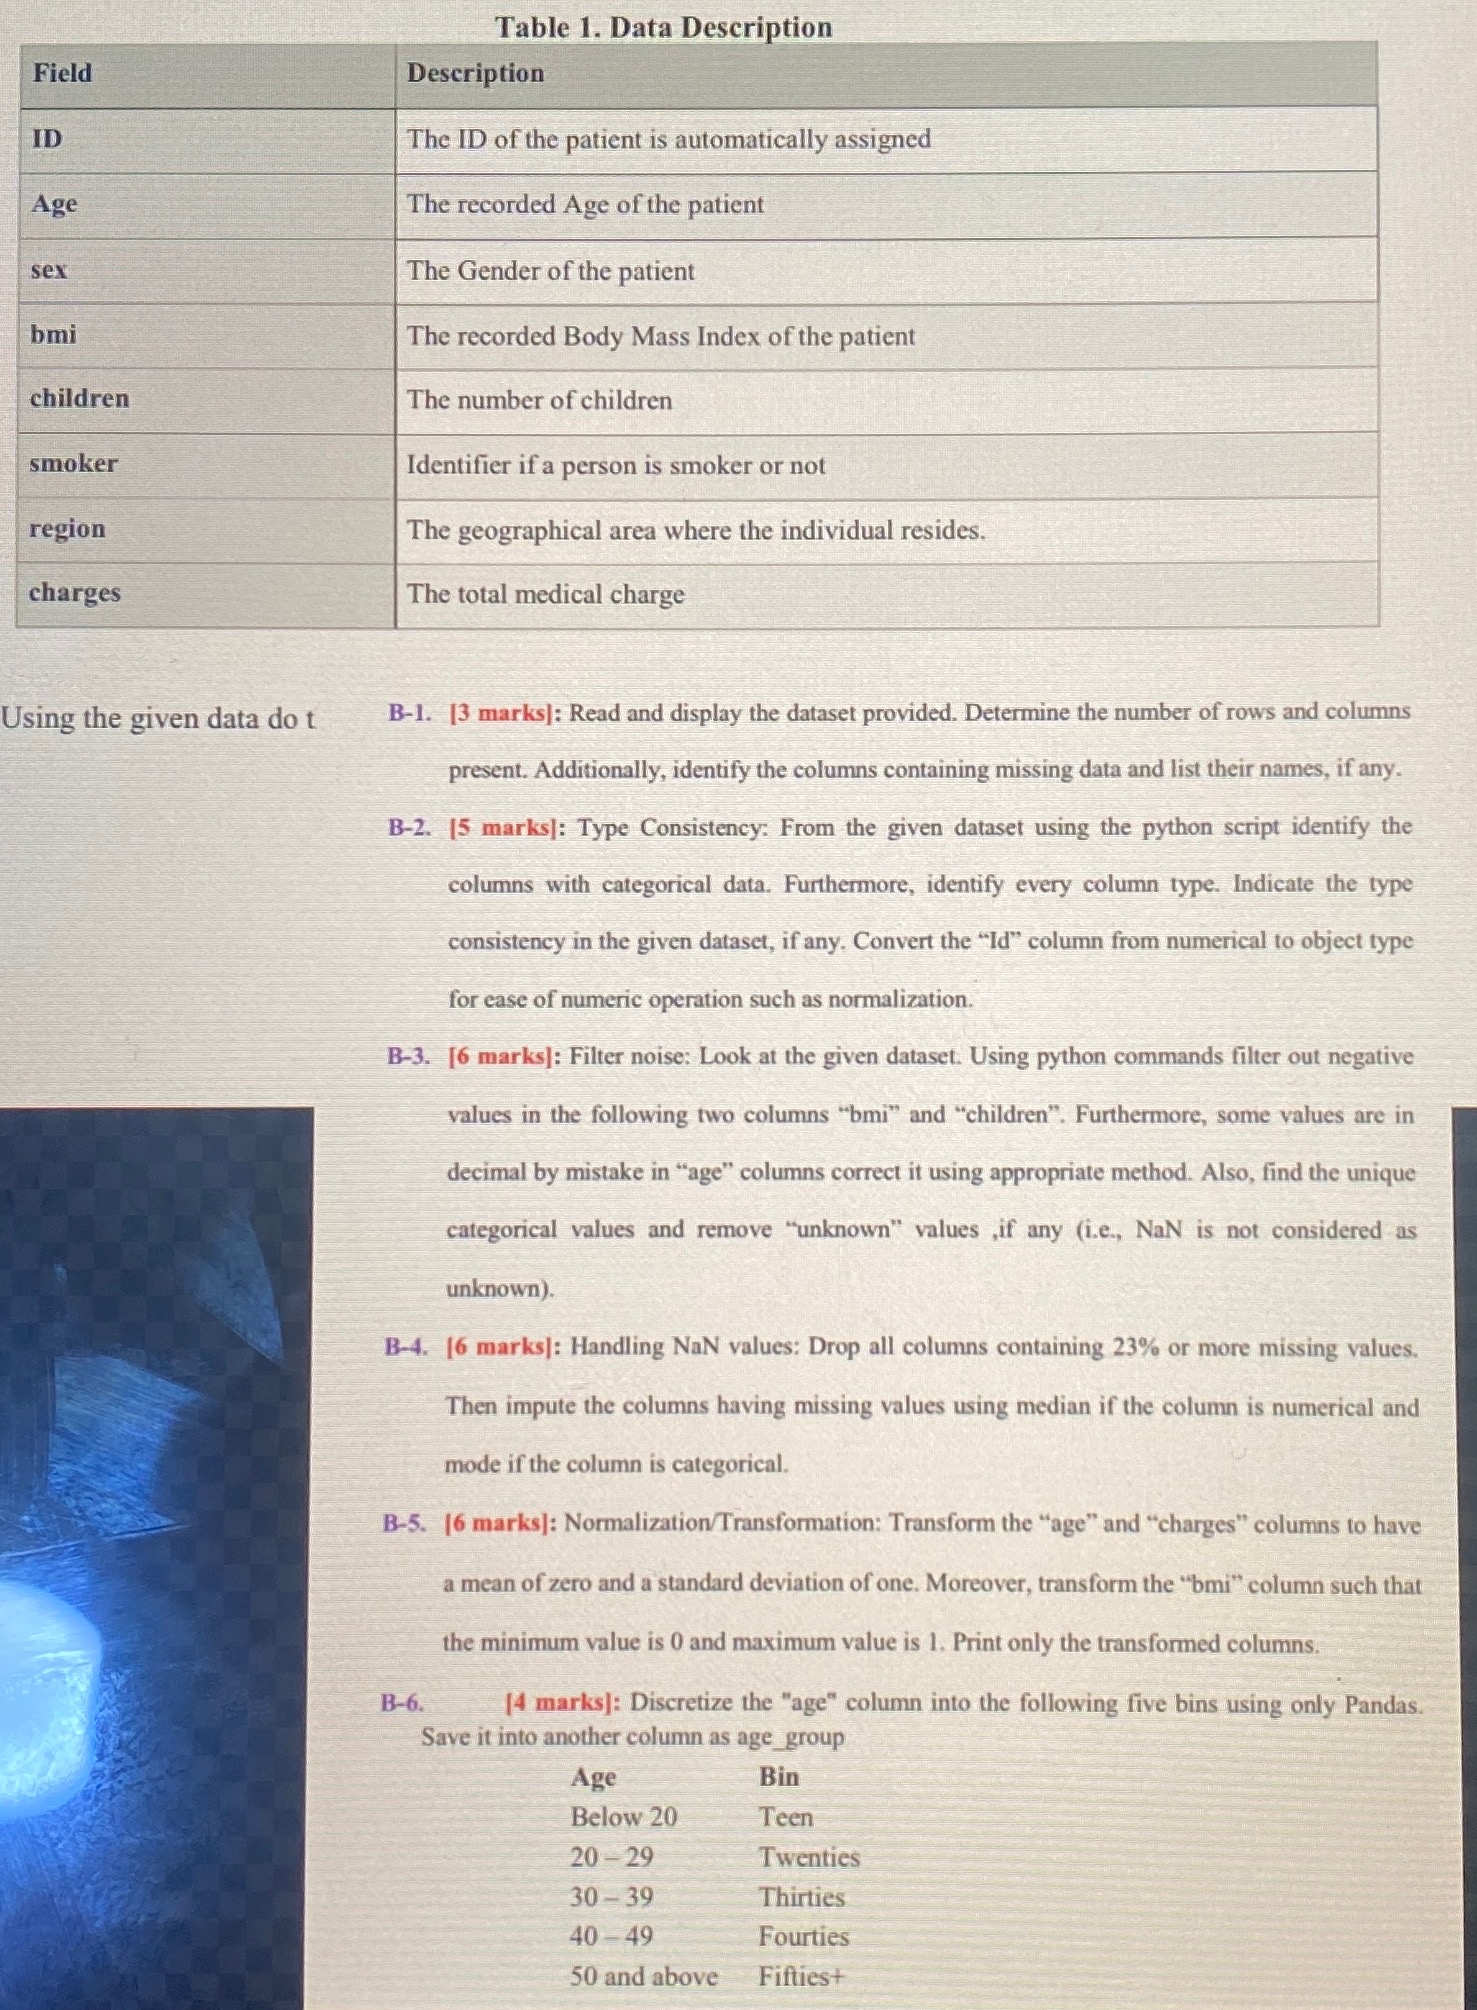
Table 1 . Data Description table [ [ Field , Description ] , [ ID , The ID of the patient is automatically assigned
Table Data Description
tableFieldDescriptionIDThe ID of the patient is automatically assignedAgeThe recorded Age of the patientsexThe Gender of the patientbmiThe recorded Body Mass Index of the patientchildrenThe number of childrensmokerIdentifier if a person is smoker or notregionThe geographical area where the individual resides.chargesThe total medical charge
Using the given data do
Using the given data do
B marks: Read and display the dataset provided. Determine the number of rows and columns present. Additionally, identify the columns containing missing data and list their names, if any.
B marks: Type Consistency: From the given dataset using the python script identify the columns with categorical data. Furthermore, identify every column type. Indicate the type consistency in the given dataset, if any. Convert the Id column from numerical to object type for ease of numeric operation such as normalization.
B marks: Filter noise: Look at the given dataset. Using python commands filter out negative values in the following two columns "bmi" and "children". Furthermore, some values are in decimal by mistake in "age" columns correct it using appropriate method. Also, find the unique categorical values and remove "unknown" values if any ie NaN is not considered as unknown
B marks: Handling NaN values: Drop all columns containing or more missing values. Then impute the columns having missing values using median if the column is numerical and mode if the column is categorical.
B marks: NormalizationTransformation: Transform the "age" and "charges" columns to have a mean of zero and a standard deviation of one. Moreover, transform the "bmi" column such that the minimum value is and maximum value is Print only the transformed columns.
B marks: Discretize the "age" column into the following five bins using only Pandas. Save it into another column as age group
tableAgeBinBelow TeenTwentiesThirtiesFourties and above,Fiftiest
Bmarks: Encoding: Convert "region" using onehot encoder. The new name should start with "region" regionnortheast Remove the original column.
B marks: Encoding: For the column "sex", convert male to and female to The column name should remain unchanged.
Bmarks: Provide a reasonable data aggregate table for the table given below. all figures are in SAR millions unless stated otherwise
tableMonthRevenue,Month,Revenue,Month,Revenue,Month,RevenueYear Year Year Year JanuaryJanuary,January,January,FebruaryFebruary,February,February,MarchMarch,March,March,AprilApril,April,April,MayMay,May,May,JuneJune,June,June,JulyJuly,July,July,AugustAugust,August,August,SeptemberSeptember,September,September,OctoberOctober,October,October,NovemberNovember,November,November,DecemberDecember,December,December,
B marks: General questions write your answers in a jupyter notebook:
i When is the discrete data useful? marks
ii List three data collection methods. marks
iii What is a minmax scaler? marks
iv Provide two sources of structured data and unstructured data. marks
v Why is there a need of data preprocessing? marks
Problem B Marks: Consider the data given in HWDataB Microsoft Excel csv file and described in Table Note: Solve all the following questions using Python. Use the Pandas & Sklearn library for all the following analyses.
Table Data Description
tableFieldDescriptionIDThe ID of the patient is automatically assignedAgeThe recorded Age of the patientsexThe Gender of the patientbmiThe recorded Body Mass Index of the patientchildrenThe number of childrensmokerIdentifier if a person is smoker or notregionThe geographical area where the individual resides.chargesThe total medical charge
Using the given data do the following:
Table Data Description
tableFieldDescriptionIDThe ID of the patient is automatically assignedAgeThe recorded Age of the patientsexThe Gender of the patientbmiThe recorded Body Mass Index of the patientchildrenThe number of childrensmokerIdentifier if a person is smoker or notregionThe geographical area where the individual resides.chargesThe total medical charge
Using the given data do
Using the given data do
B marks: Read and display the dataset provided. Determine th

Step by Step Solution
There are 3 Steps involved in it
Step: 1

Get Instant Access to Expert-Tailored Solutions
See step-by-step solutions with expert insights and AI powered tools for academic success
Step: 2

Step: 3

Ace Your Homework with AI
Get the answers you need in no time with our AI-driven, step-by-step assistance
Get Started


