Question
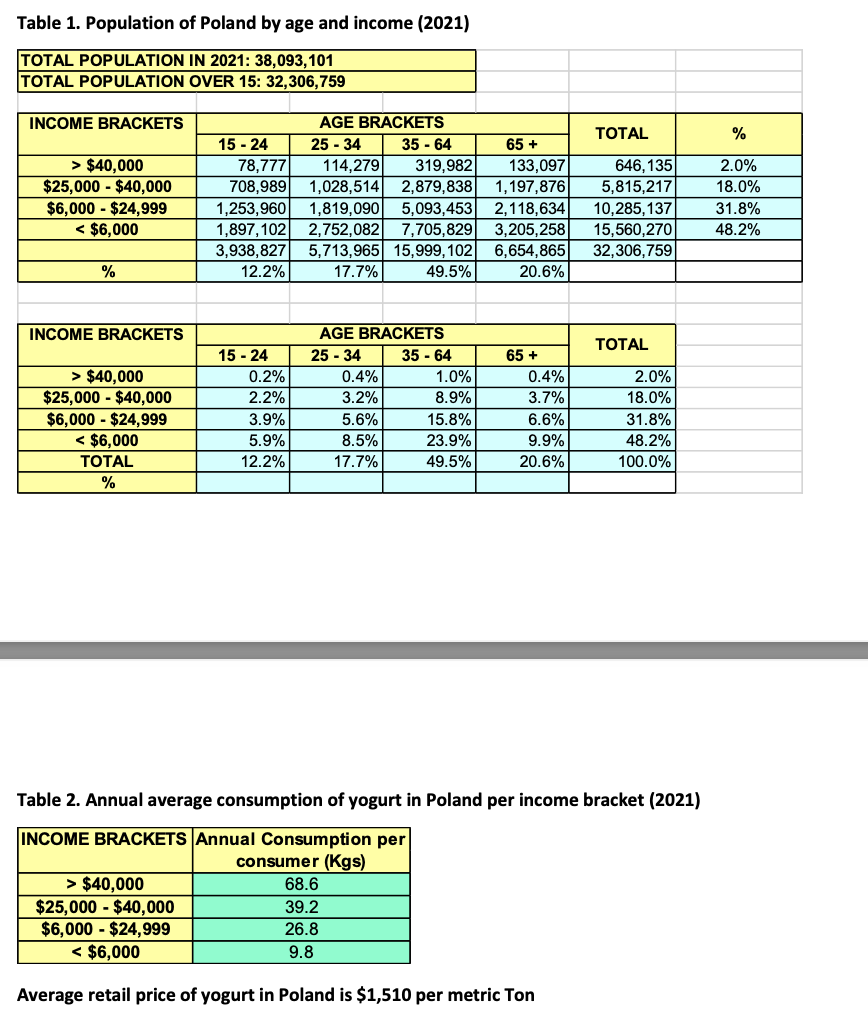
Table 1 depicts the population of Poland by age and income brackets. In addition, Table 2 shows the average consumption of yogurt per Polish consumer
Table 1 depicts the population of Poland by age and income brackets. In addition, Table 2 shows the average consumption of yogurt per Polish consumer by income bracket, as well as the average retail price of yogurt in Poland. Finally, you will also make the following assumptions: ? Average consumption in each income bracket is the same across age brackets (i.e., each age group in each income bracket consumes on average the same amount of yogurt).
The yogurt market in Poland is at a mature stage but still growing at about a +0.8% - +1.2% CAGR. That is, most consumers in the market consume yogurt, but at different average rates.

Step by Step Solution
There are 3 Steps involved in it
Step: 1

Get Instant Access to Expert-Tailored Solutions
See step-by-step solutions with expert insights and AI powered tools for academic success
Step: 2

Step: 3

Ace Your Homework with AI
Get the answers you need in no time with our AI-driven, step-by-step assistance
Get Started


