

Answered step by step
Verified Expert Solution
Question
1 Approved Answer
Table 1. Input data for transmission lines and transformers. Table 2. Input data for generators and loads Questions: Find all busbar voltages (amplitudes and angles).
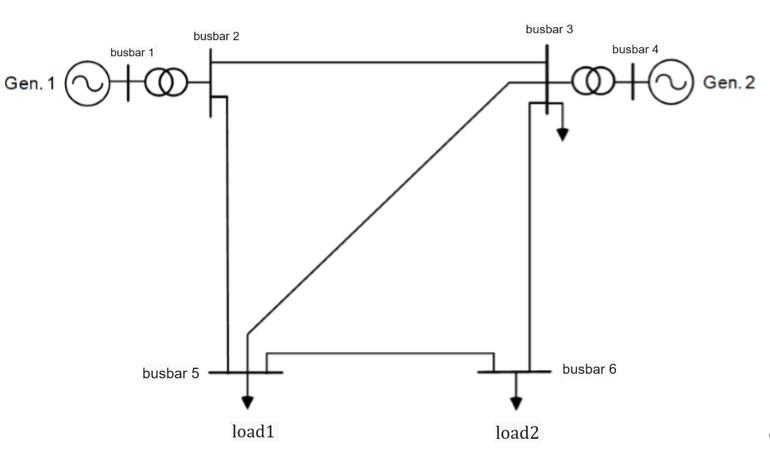
Table 1. Input data for transmission lines and transformers.
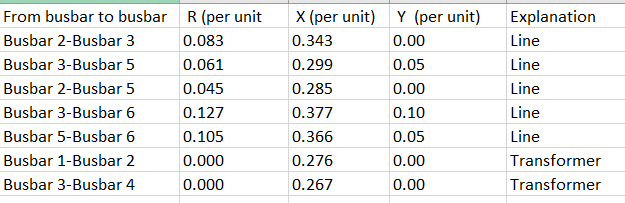
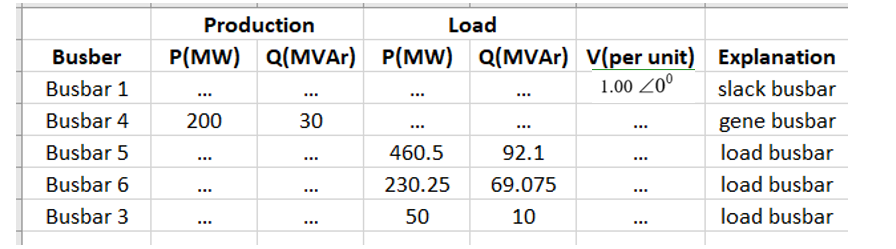
Table 2. Input data for generators and loads
Questions:
- Find all busbar voltages (amplitudes and angles).
- Find the amount and direction of power flow in each transmission line in power system.
- Find the total power loss in the system. Try to reduce this power loss by adding capacitive load to the busbar. Explain how much reduction you achieved.
- Consider that the transmission lines can transmit a maximum of 400 MVA. Determine the maximum load on Busbar 5 by increasing the load on Busbar 5 to the maximum limit of a transmission line. What are the voltages in the busbars under this limit and which transmission line reaches its own loadability limit?
- Calculate fault currents in amperes by running the program for 3 phase balanced faults in each busbar. (Generator reactances XG1 = XG2 = 0.20 pu)
- Draw the single line diagram of the system.
busbar 2 busbar 3 busbar 1 busbar 4 Gen. 1 FO HO Gen.2. busbar 5 busbar 6 load 1 load 2 From busbar to busbar R (per unit Busbar 2-Busbar 3 0.083 Busbar 3-Busbar 5 0.061 Busbar 2-Busbar 5 0.045 Busbar 3-Busbar 6 0.127 Busbar 5-Busbar 6 0.105 Busbar 1-Busbar 2 0.000 Busbar 3-Busbar 4 0.000 X(per unit) Y (per unit) 0.343 0.00 0.299 0.05 0.285 0.00 0.377 0.10 0.366 0.05 0.276 0.00 0.267 0.00 Explanation Line Line Line Line Line Transformer Transformer ... Busber Busbar 1 Busbar 4 Busbar 5 Busbar 6 Busbar 3 Production Load P(MW) Q(MVAr) P(MW) Q(MVAr) V(per unit) Explanation 1.00 20 slack busbar 200 30 gene busbar 460.5 92.1 load busbar 230.25 69.075 load busbar 50 10 load busbar ... ... ... .. .. ... ... busbar 2 busbar 3 busbar 1 busbar 4 Gen. 1 FO HO Gen.2. busbar 5 busbar 6 load 1 load 2 From busbar to busbar R (per unit Busbar 2-Busbar 3 0.083 Busbar 3-Busbar 5 0.061 Busbar 2-Busbar 5 0.045 Busbar 3-Busbar 6 0.127 Busbar 5-Busbar 6 0.105 Busbar 1-Busbar 2 0.000 Busbar 3-Busbar 4 0.000 X(per unit) Y (per unit) 0.343 0.00 0.299 0.05 0.285 0.00 0.377 0.10 0.366 0.05 0.276 0.00 0.267 0.00 Explanation Line Line Line Line Line Transformer Transformer ... Busber Busbar 1 Busbar 4 Busbar 5 Busbar 6 Busbar 3 Production Load P(MW) Q(MVAr) P(MW) Q(MVAr) V(per unit) Explanation 1.00 20 slack busbar 200 30 gene busbar 460.5 92.1 load busbar 230.25 69.075 load busbar 50 10 load busbar
Step by Step Solution
There are 3 Steps involved in it
Step: 1

Get Instant Access to Expert-Tailored Solutions
See step-by-step solutions with expert insights and AI powered tools for academic success
Step: 2

Step: 3
Ace Your Homework with AI
Get the answers you need in no time with our AI-driven, step-by-step assistance
Get Started
Managerial Accounting
Authors: Brenda Mallouk
2nd Edition
017640709X, 978-0176407094