

Answered step by step
Verified Expert Solution
Question
1 Approved Answer
Table 1, queuing theory (before) shows that RN utilization was 56% at the time of day 0100. Explain how the utilization was calculated (what values
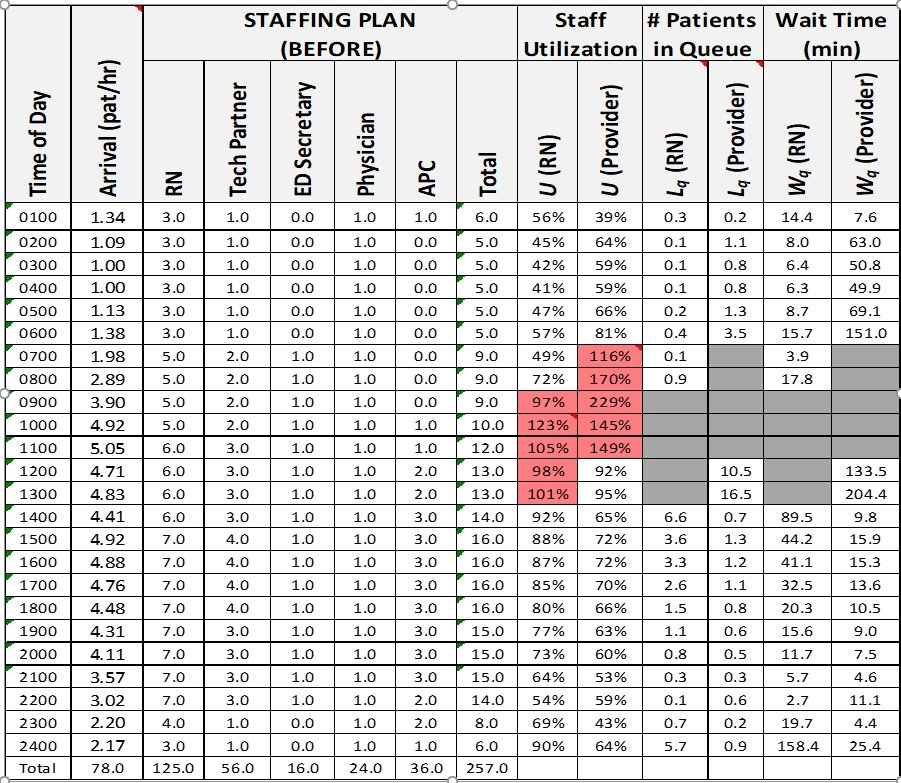
- Table 1, queuing theory (before) shows that RN utilization was 56% at the time of day 0100. Explain how the utilization was calculated (what values were used for a, p, m)?
- Table 1: at the time 0700, the physician wait time was not calculated. Why do you think that is?
Step by Step Solution
There are 3 Steps involved in it
Step: 1

Get Instant Access to Expert-Tailored Solutions
See step-by-step solutions with expert insights and AI powered tools for academic success
Step: 2

Step: 3
Ace Your Homework with AI
Get the answers you need in no time with our AI-driven, step-by-step assistance
Get Started
Security Audit And Control Features SAP ERP
Authors: Deloitte Touche Tohmatsu Research Team And Isaca
3rd Edition
1604201150, 978-1604201154