Answered step by step
Verified Expert Solution
Link Copied!

Question

1 Approved Answer

TABLE 1. RISK RATING ON BORROWER CHARACTERISTICS Solvency Profitability Liquidity Repayment CDRM (1000) Leverage Debt-to-Asset ROFA (%) Current Ratio Risk Class Coverage Debt-Service Coverage Average
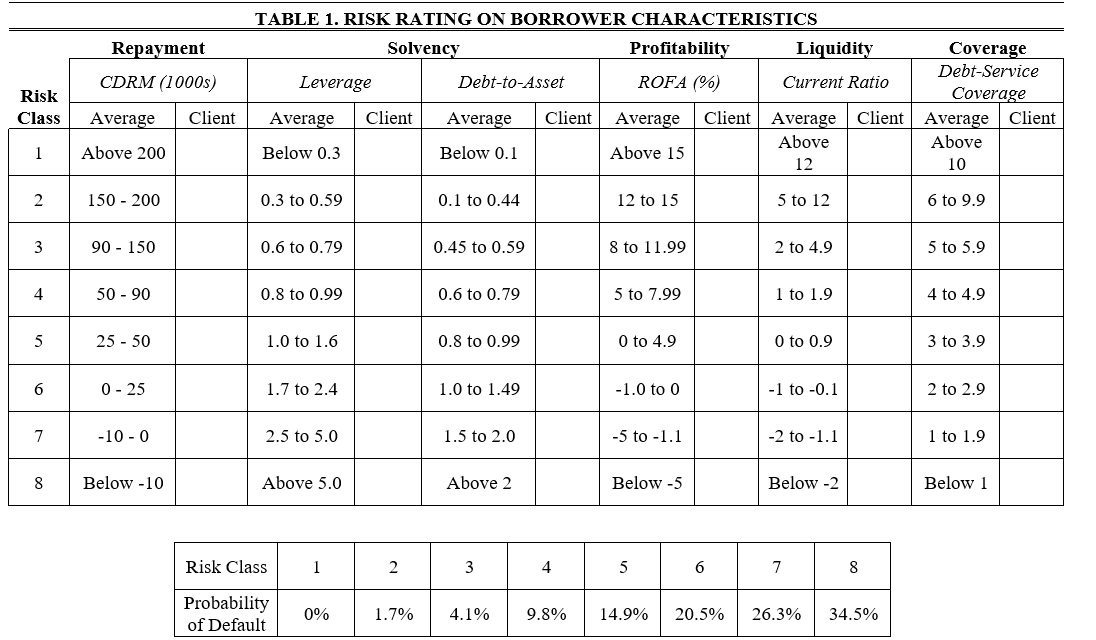
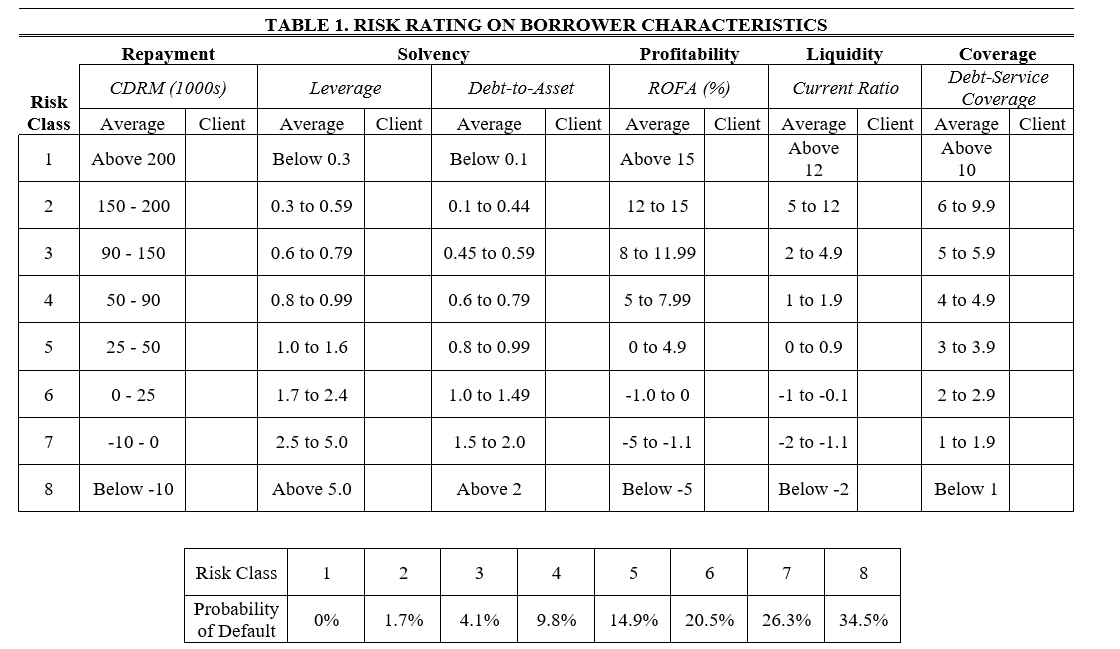
image text in transcribedimage text in transcribedimage text in transcribedimage text in transcribedimage text in transcribed

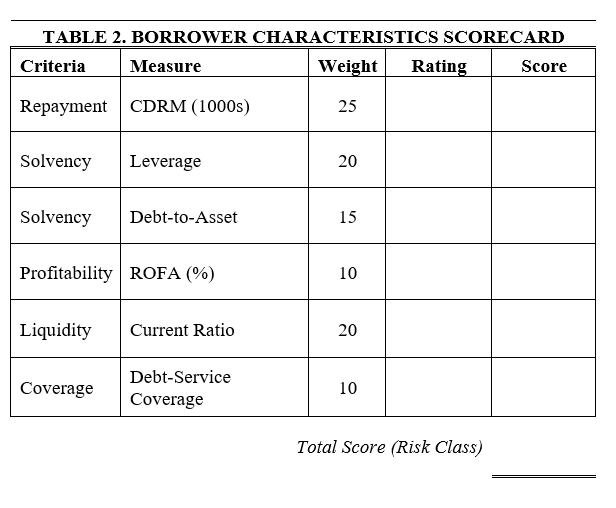
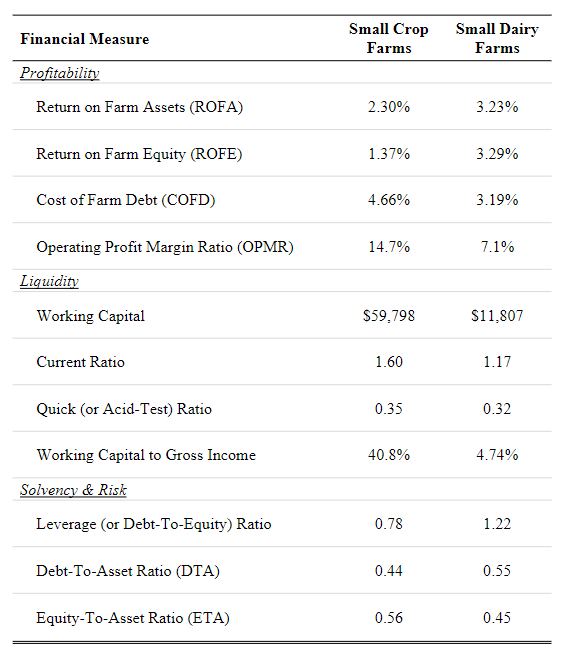
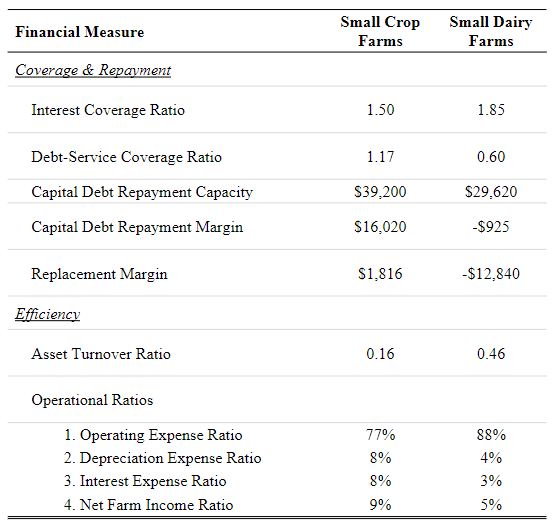
TABLE 1. RISK RATING ON BORROWER CHARACTERISTICS Solvency Profitability Liquidity Repayment CDRM (1000) Leverage Debt-to-Asset ROFA (%) Current Ratio Risk Class Coverage Debt-Service Coverage Average Client Above 10 Client Average Client Average Client Average Above 200 Average Above 15 Client Average Client Above 12 1 Below 0.3 Below 0.1 2 150 - 200 0.3 to 0.59 0.1 to 0.44 12 to 15 5 to 12 6 to 9.9 3 90 - 150 0.6 to 0.79 0.45 to 0.59 8 to 11.99 2 to 4.9 5 to 5.9 4 50 - 90 0.8 to 0.99 0.6 to 0.79 5 to 7.99 1 to 1.9 4 to 4.9 5 25 - 50 1.0 to 1.6 0.8 to 0.99 0 to 4.9 O to 0.9 3 to 3.9 6 0 - 25 1.7 to 2.4 1.0 to 1.49 -1.0 to 0 -1 to -0.1 2 to 2.9 7 -10-0 2.5 to 5.0 1.5 to 2.0 -5 to -1.1 -2 to -1.1 1 to 1.9 8 Below -10 Above 5.0 Above 2 Below -5 Below -2 Below 1 Risk Class 1 2 3 4 5 6 7 8 Probability of Default 0% 1.7% 4.1% 9.8% 14.9% 20.5% 26.3% 34.5% Repayment CDRM (1000s) Risk Class TABLE 1. RISK RATING ON BORROWER CHARACTERISTICS Solvency Profitability Liquidity Coverage Debt-Service Leverage Debt-to-Asset ROFA (%) Current Ratio Coverage Average Client Average Client Average Client Average Client Average Client Above Above Below 0.3 Below 0.1 Above 15 12 10 Average Client 1 Above 200 2 150 - 200 0.3 to 0.59 0.1 to 0.44 12 to 15 5 to 12 6 to 9.9 3 90 - 150 0.6 to 0.79 0.45 to 0.59 8 to 11.99 2 to 4.9 5 to 5.9 4 50 - 90 0.8 to 0.99 0.6 to 0.79 5 to 7.99 1 to 1.9 4 to 4.9 5 25 - 50 1.0 to 1.6 0.8 to 0.99 0 to 4.9 0 to 0.9 3 to 3.9 6 0 - 25 1.7 to 2.4 1.0 to 1.49 -1.0 to 0 -1 to -0.1 2 to 2.9 7 -10-0 2.5 to 5.0 1.5 to 2.0 -5 to -1.1 -2 to -1.1 1 to 1.9 8 Below -10 Above 5.0 Above 2 Below -5 Below -2 Below 1 Risk Class 1 2 3 6 7 8 Probability of Default 0% 1.7% 4.1% 9.8% 14.9% 20.5% 26.3% 34.5% Financial Measure Small Crop Farms Small Dairy Farms Profitability Return on Farm Assets (ROFA) 2.30% 3.23% Return on Farm Equity (ROFE) 1.37% 3.29% Cost of Farm Debt (COFD) 4.66% 3.19% Operating Profit Margin Ratio (OPMR) 14.7% 7.1% Liquidity Working Capital $59.798 $11,807 Current Ratio 1.60 1.17 Quick (or Acid-Test) Ratio 0.35 0.32 Working Capital to Gross Income 40.8% 4.74% Solvency & Risk Leverage (or Debt-To-Equity) Ratio 0.78 1.22 Debt-To-Asset Ratio (DTA) 0.44 0.55 Equity-To-Asset Ratio (ETA) 0.56 0.45 Financial Measure Small Crop Farms Small Dairy Farms Coverage & Repayment Interest Coverage Ratio 1.50 1.85 1.17 0.60 Debt-Service Coverage Ratio Capital Debt Repayment Capacity $39,200 $29.620 Capital Debt Repayment Margin $16,020 -$925 Replacement Margin $1,816 -$12.840 Efficiency Asset Turnover Ratio 0.16 0.46 Operational Ratios 1. Operating Expense Ratio 2. Depreciation Expense Ratio 3. Interest Expense Ratio 4. Net Farm Income Ratio 77% 8% 8% 9% 88% 4% 3% 5% TABLE 2. BORROWER CHARACTERISTICS SCORECARD Criteria Measure Weight Rating Score Repayment CDRM (1000s) 25 Solvency Leverage 20 Solvency Debt-to-Asset 15 Profitability ROFA (%) 10 Liquidity Current Ratio 20 Coverage Debt-Service Coverage 10 Total Score (Risk Class) TABLE 1. RISK RATING ON BORROWER CHARACTERISTICS Solvency Profitability Liquidity Repayment CDRM (1000) Leverage Debt-to-Asset ROFA (%) Current Ratio Risk Class Coverage Debt-Service Coverage Average Client Above 10 Client Average Client Average Client Average Above 200 Average Above 15 Client Average Client Above 12 1 Below 0.3 Below 0.1 2 150 - 200 0.3 to 0.59 0.1 to 0.44 12 to 15 5 to 12 6 to 9.9 3 90 - 150 0.6 to 0.79 0.45 to 0.59 8 to 11.99 2 to 4.9 5 to 5.9 4 50 - 90 0.8 to 0.99 0.6 to 0.79 5 to 7.99 1 to 1.9 4 to 4.9 5 25 - 50 1.0 to 1.6 0.8 to 0.99 0 to 4.9 O to 0.9 3 to 3.9 6 0 - 25 1.7 to 2.4 1.0 to 1.49 -1.0 to 0 -1 to -0.1 2 to 2.9 7 -10-0 2.5 to 5.0 1.5 to 2.0 -5 to -1.1 -2 to -1.1 1 to 1.9 8 Below -10 Above 5.0 Above 2 Below -5 Below -2 Below 1 Risk Class 1 2 3 4 5 6 7 8 Probability of Default 0% 1.7% 4.1% 9.8% 14.9% 20.5% 26.3% 34.5% Repayment CDRM (1000s) Risk Class TABLE 1. RISK RATING ON BORROWER CHARACTERISTICS Solvency Profitability Liquidity Coverage Debt-Service Leverage Debt-to-Asset ROFA (%) Current Ratio Coverage Average Client Average Client Average Client Average Client Average Client Above Above Below 0.3 Below 0.1 Above 15 12 10 Average Client 1 Above 200 2 150 - 200 0.3 to 0.59 0.1 to 0.44 12 to 15 5 to 12 6 to 9.9 3 90 - 150 0.6 to 0.79 0.45 to 0.59 8 to 11.99 2 to 4.9 5 to 5.9 4 50 - 90 0.8 to 0.99 0.6 to 0.79 5 to 7.99 1 to 1.9 4 to 4.9 5 25 - 50 1.0 to 1.6 0.8 to 0.99 0 to 4.9 0 to 0.9 3 to 3.9 6 0 - 25 1.7 to 2.4 1.0 to 1.49 -1.0 to 0 -1 to -0.1 2 to 2.9 7 -10-0 2.5 to 5.0 1.5 to 2.0 -5 to -1.1 -2 to -1.1 1 to 1.9 8 Below -10 Above 5.0 Above 2 Below -5 Below -2 Below 1 Risk Class 1 2 3 6 7 8 Probability of Default 0% 1.7% 4.1% 9.8% 14.9% 20.5% 26.3% 34.5% Financial Measure Small Crop Farms Small Dairy Farms Profitability Return on Farm Assets (ROFA) 2.30% 3.23% Return on Farm Equity (ROFE) 1.37% 3.29% Cost of Farm Debt (COFD) 4.66% 3.19% Operating Profit Margin Ratio (OPMR) 14.7% 7.1% Liquidity Working Capital $59.798 $11,807 Current Ratio 1.60 1.17 Quick (or Acid-Test) Ratio 0.35 0.32 Working Capital to Gross Income 40.8% 4.74% Solvency & Risk Leverage (or Debt-To-Equity) Ratio 0.78 1.22 Debt-To-Asset Ratio (DTA) 0.44 0.55 Equity-To-Asset Ratio (ETA) 0.56 0.45 Financial Measure Small Crop Farms Small Dairy Farms Coverage & Repayment Interest Coverage Ratio 1.50 1.85 1.17 0.60 Debt-Service Coverage Ratio Capital Debt Repayment Capacity $39,200 $29.620 Capital Debt Repayment Margin $16,020 -$925 Replacement Margin $1,816 -$12.840 Efficiency Asset Turnover Ratio 0.16 0.46 Operational Ratios 1. Operating Expense Ratio 2. Depreciation Expense Ratio 3. Interest Expense Ratio 4. Net Farm Income Ratio 77% 8% 8% 9% 88% 4% 3% 5% TABLE 2. BORROWER CHARACTERISTICS SCORECARD Criteria Measure Weight Rating Score Repayment CDRM (1000s) 25 Solvency Leverage 20 Solvency Debt-to-Asset 15 Profitability ROFA (%) 10 Liquidity Current Ratio 20 Coverage Debt-Service Coverage 10 Total Score (Risk Class)
Step by Step Solution

There are 3 Steps involved in it

Step: 1

blur-text-image

Get Instant Access to Expert-Tailored Solutions

See step-by-step solutions with expert insights and AI powered tools for academic success

Step: 2

blur-text-image

Step: 3

blur-text-image

Ace Your Homework with AI

Get the answers you need in no time with our AI-driven, step-by-step assistance

Get Started

Recommended Textbook for

Monetary Policy After The Great Recession The Role Of Interest Rates

Authors: Arkadiusz Sieron

1st Edition

0367471892, 978-0367471897

More Books

Students also viewed these Finance questions