

Answered step by step
Verified Expert Solution
Question
1 Approved Answer
Table 1: South Africa's Actual vs Forecast macroeconomic indicators for March 2022 Summary of selected forecast results Figures below the forecast in parentheses represents the
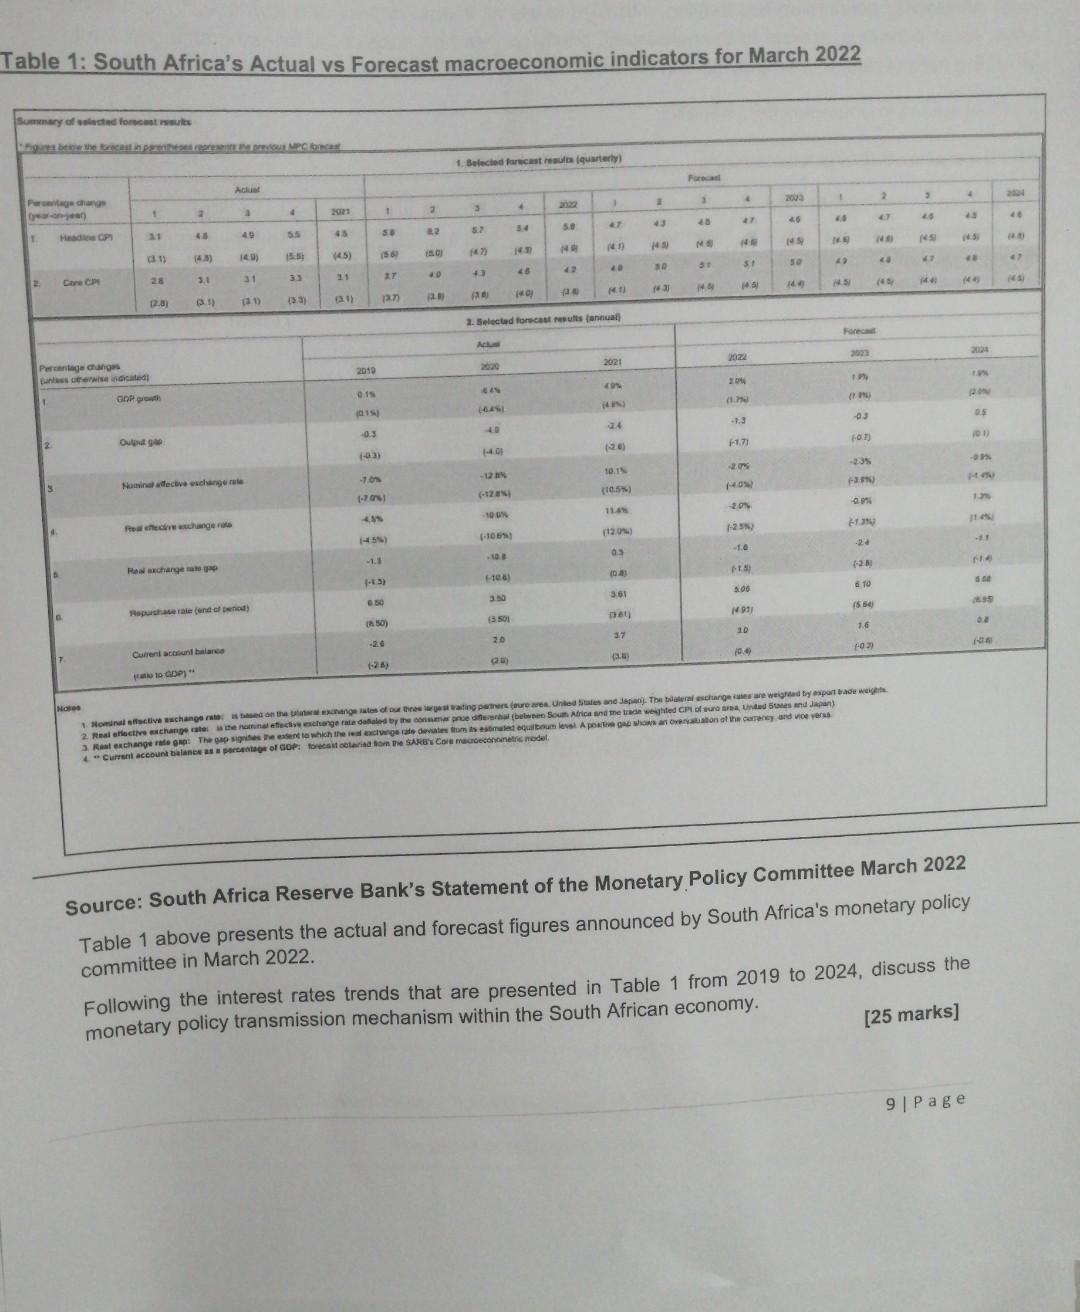
Table 1: South Africa's Actual vs Forecast macroeconomic indicators for March 2022 Summary of selected forecast results Figures below the forecast in parentheses represents the previous MPC bocest 1. Selected forecast results (quarterly) Actual Foreca Persentage change (year-on-year) 2023 3 1 2 1 2 1 a 4 4 2021 3 5.7 46 45 4.5 1. Headie CP 49 5.5 5.0 45 (45) 14.6 (4.1) (31) (4.5) (4.9) (5.5) (47) (4.5) 14.9 HA M..S 31 50 44 40 46 43 2 Core CP 28 31 3.1 11 3.3 49 14.51 14.4) (45) 14.4 (34) (1) (40) (2.8) (21) (30) (3.3) (4.1) 2. Selected forecast results (annual) Forecast Actum 2023 2022 Percentage changes 2021 2019 Bunless otherwise indicated 199 49% GDP growt (1.790) (1996) (64%) 0.15 (015) -0.3 -0.3 24 Output ga (0.7) (-1.7) (-2.8) (43) -235 20% 10.1% -12% -7.0% Nominal affective exchange rate (-389) (-4.0%) (-12.8%) (10.5%) -20% 11.4% -100% 435 Freal effective change rate (-1.3%) (-2.5%) (-10%) (12.0%) -24 -1.0 0.3 -10.8 -1.1 Real exchange sa gap (04) (-1.5) (-83) (106) 6 10 5.00 3.61 6.50 3.50 Repurchase rate (end of period) B (554) 14.911 (41) (3.501 (50) 10 1.6 37 Current account balance 20 (20) (0.4) (-03) (18) (-26) (a to GDP) Notes 1. Nominal effective change rate: is based on the late exchange rates of our three largest rating partners (euro areas. United States and Japan). The bilateral exchange rates are weighted by asport Bade weights 2. Real effective exchange rate as the nominal effective exchange rate dealed by the consumer price differential (between South Africa and the trade weighted CPI of suro area, United States and Japan) 3 Rast exchange rate gap: The gap signifies the extent to which the real exchange rate deviates from is estimated equilbaum levei A poate gap shows an oversatiation of the currency and vice versa Current account balance as a percentage of GDP: forecast ootariad Rom the SARB's Core macroeconometric model Source: South Africa Reserve Bank's Statement of the Monetary Policy Committee March 2022 Table 1 above presents the actual and forecast figures announced by South Africa's monetary policy committee in March 2022. Following the interest rates trends that are presented in Table 1 from 2019 to 2024, discuss the monetary policy transmission mechanism within the South African economy. [25 marks] 9| Page 1 58 (56) 27 (37) 2 8.2 15.01 40 (28) 2 43 (4.5) 30 (43) 4 47 NA 5.1 (4.5) 3 4.0 (45) 4.7 (44) 4 43 (4.5) 48 (44) (2.0% (0.1) 43% 14.454 1.26 (1.4 5.00 1835 0.4 (38) 2004 40 47 (45) Table 1: South Africa's Actual vs Forecast macroeconomic indicators for March 2022 Summary of selected forecast results Figures below the forecast in parentheses represents the previous MPC bocest 1. Selected forecast results (quarterly) Actual Foreca Persentage change (year-on-year) 2023 3 1 2 1 2 1 a 4 4 2021 3 5.7 46 45 4.5 1. Headie CP 49 5.5 5.0 45 (45) 14.6 (4.1) (31) (4.5) (4.9) (5.5) (47) (4.5) 14.9 HA M..S 31 50 44 40 46 43 2 Core CP 28 31 3.1 11 3.3 49 14.51 14.4) (45) 14.4 (34) (1) (40) (2.8) (21) (30) (3.3) (4.1) 2. Selected forecast results (annual) Forecast Actum 2023 2022 Percentage changes 2021 2019 Bunless otherwise indicated 199 49% GDP growt (1.790) (1996) (64%) 0.15 (015) -0.3 -0.3 24 Output ga (0.7) (-1.7) (-2.8) (43) -235 20% 10.1% -12% -7.0% Nominal affective exchange rate (-389) (-4.0%) (-12.8%) (10.5%) -20% 11.4% -100% 435 Freal effective change rate (-1.3%) (-2.5%) (-10%) (12.0%) -24 -1.0 0.3 -10.8 -1.1 Real exchange sa gap (04) (-1.5) (-83) (106) 6 10 5.00 3.61 6.50 3.50 Repurchase rate (end of period) B (554) 14.911 (41) (3.501 (50) 10 1.6 37 Current account balance 20 (20) (0.4) (-03) (18) (-26) (a to GDP) Notes 1. Nominal effective change rate: is based on the late exchange rates of our three largest rating partners (euro areas. United States and Japan). The bilateral exchange rates are weighted by asport Bade weights 2. Real effective exchange rate as the nominal effective exchange rate dealed by the consumer price differential (between South Africa and the trade weighted CPI of suro area, United States and Japan) 3 Rast exchange rate gap: The gap signifies the extent to which the real exchange rate deviates from is estimated equilbaum levei A poate gap shows an oversatiation of the currency and vice versa Current account balance as a percentage of GDP: forecast ootariad Rom the SARB's Core macroeconometric model Source: South Africa Reserve Bank's Statement of the Monetary Policy Committee March 2022 Table 1 above presents the actual and forecast figures announced by South Africa's monetary policy committee in March 2022. Following the interest rates trends that are presented in Table 1 from 2019 to 2024, discuss the monetary policy transmission mechanism within the South African economy. [25 marks] 9| Page 1 58 (56) 27 (37) 2 8.2 15.01 40 (28) 2 43 (4.5) 30 (43) 4 47 NA 5.1 (4.5) 3 4.0 (45) 4.7 (44) 4 43 (4.5) 48 (44) (2.0% (0.1) 43% 14.454 1.26 (1.4 5.00 1835 0.4 (38) 2004 40 47 (45)
Step by Step Solution
There are 3 Steps involved in it
Step: 1

Get Instant Access to Expert-Tailored Solutions
See step-by-step solutions with expert insights and AI powered tools for academic success
Step: 2

Step: 3
Ace Your Homework with AI
Get the answers you need in no time with our AI-driven, step-by-step assistance
Get Started
Finance For Small And Entrepreneurial Business
Authors: Richard Roberts
1st Edition
0415721008, 978-0415721004