

Answered step by step
Verified Expert Solution
Question
1 Approved Answer
Table 1 Test 1 Test 2 Anna 84 96 Bruce 56 72 83 Chris 78 David 82 91 The table shows the first two
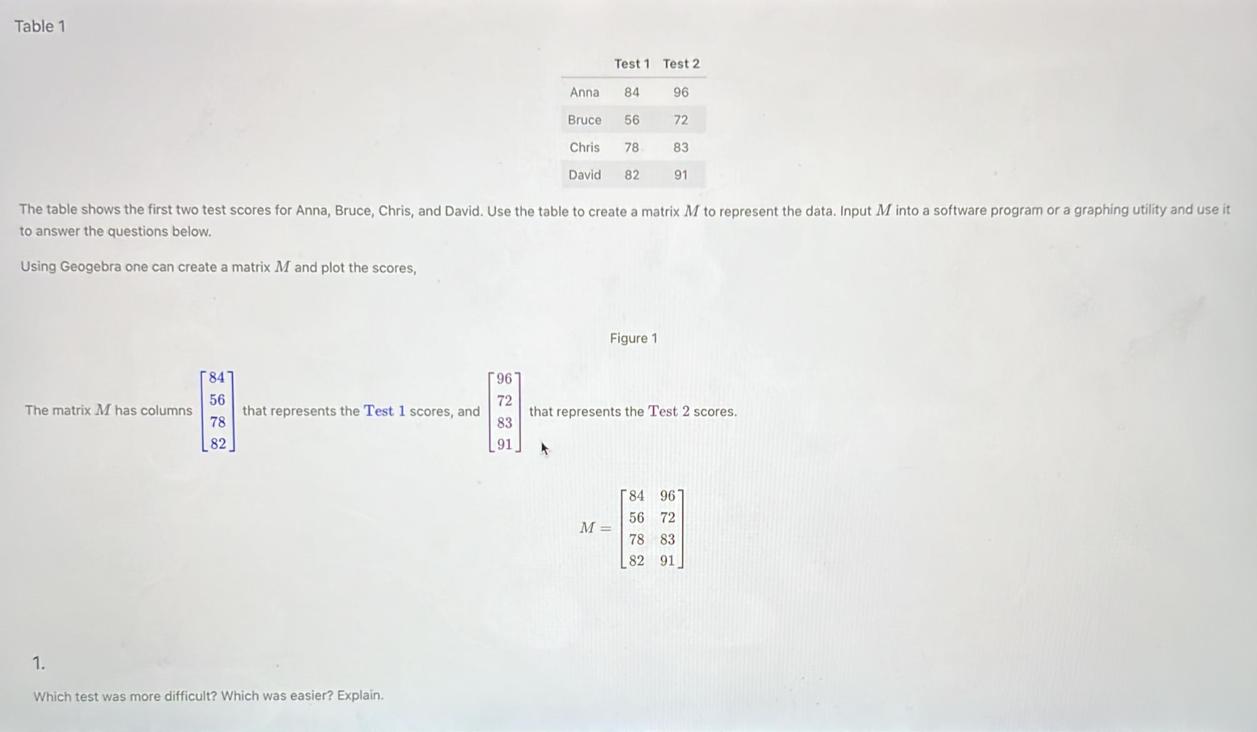

Table 1 Test 1 Test 2 Anna 84 96 Bruce 56 72 83 Chris 78 David 82 91 The table shows the first two test scores for Anna, Bruce, Chris, and David. Use the table to create a matrix M to represent the data. Input M into a software program or a graphing utility and use it to answer the questions below. Using Geogebra one can create a matrix M and plot the scores, Figure 1 847 96' 56 72 The matrix M has columns that represents the Test 1 scores, and that represents the Test 2 scores. 78 83 82 1. Which test was more difficult? Which was easier? Explain. 84 96 56 72 M = 78 83 82 91
Step by Step Solution
There are 3 Steps involved in it
Step: 1

Get Instant Access to Expert-Tailored Solutions
See step-by-step solutions with expert insights and AI powered tools for academic success
Step: 2

Step: 3
Ace Your Homework with AI
Get the answers you need in no time with our AI-driven, step-by-step assistance
Get Started
Partial Differential Equations With Fourier Series And Boundary Value Problems
Authors: Nakhle H Asmar
1st Edition
0486820831, 9780486820835