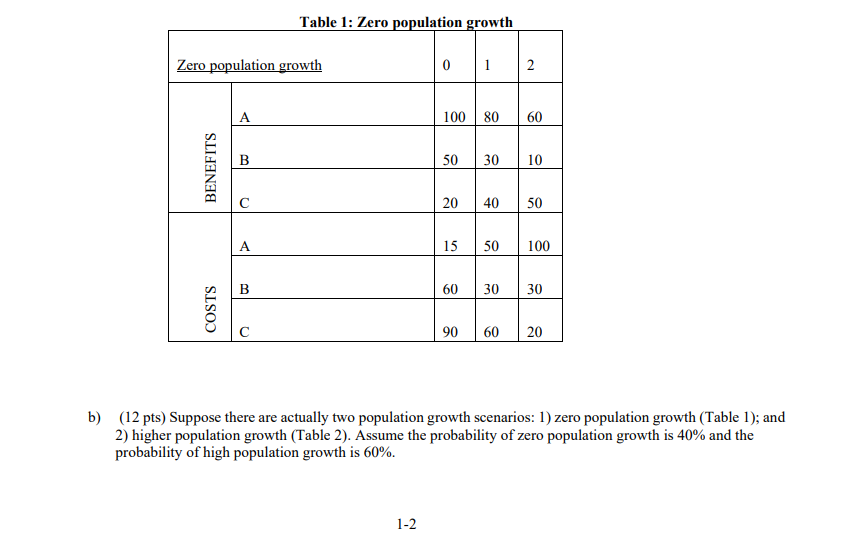
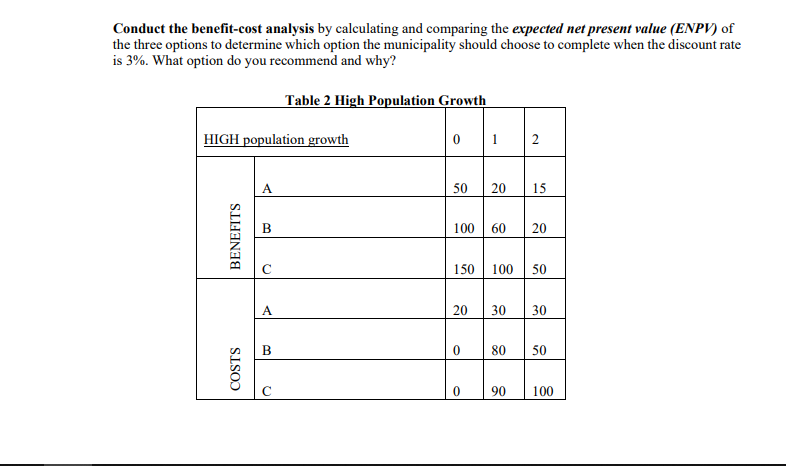
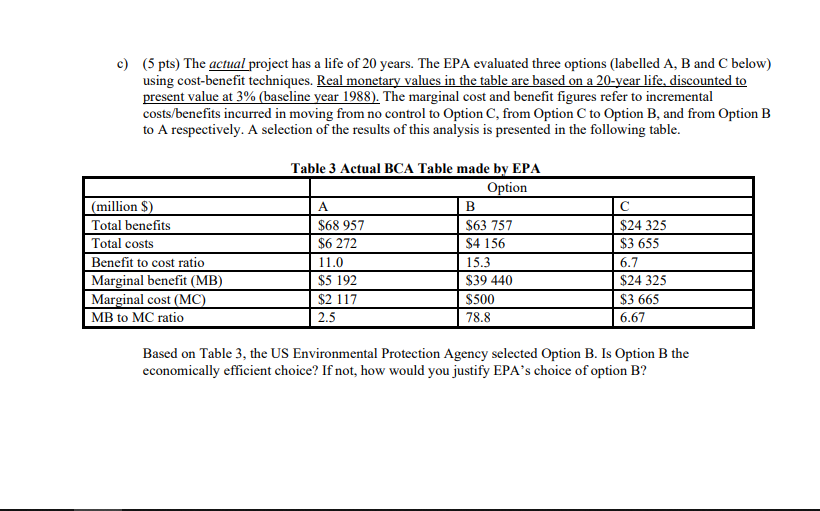
Table 1: Zero population growth Zero population growth 100 80 60 50 30 10 BENEFITS 20 40 50 50 100 COSTS 90 60 20 b) (12 pts) Suppose there are actually two population growth scenarios: 1) zero population growth (Table 1); and 2) higher population growth (Table 2). Assume the probability of zero population growth is 40% and the probability of high population growth is 60%. 1-2 c) (5 pts) The actual project has a life of 20 years. The EPA evaluated three options (labelled A, B and C below) using cost-benefit techniques. Real monetary values in the table are based on a 20-year life, discounted to present value at 3% (baseline year 1988). The marginal cost and benefit figures refer to incremental costs/benefits incurred in moving from no control to Option C, from Option C to Option B, and from Option B to A respectively. A selection of the results of this analysis is presented in the following table. | (million $) Total benefits Total costs Benefit to cost ratio Marginal benefit (MB) Marginal cost (MC) MB to MC ratio Table 3 Actual BCA Table made by EPA Option B $68 957 $63 757 $6 272 $4 156 11.0 15.3 $5 192 $39 440 $2 117 $500 2.5 78.8 $24 325 $3655 6.7 $24 325 $3 665 6.67 Based on Table 3, the US Environmental Protection Agency selected Option B. Is Option B the economically efficient choice? If not, how would you justify EPA's choice of option B? Table 1: Zero population growth Zero population growth 100 80 60 50 30 10 BENEFITS 20 40 50 50 100 COSTS 90 60 20 b) (12 pts) Suppose there are actually two population growth scenarios: 1) zero population growth (Table 1); and 2) higher population growth (Table 2). Assume the probability of zero population growth is 40% and the probability of high population growth is 60%. 1-2 c) (5 pts) The actual project has a life of 20 years. The EPA evaluated three options (labelled A, B and C below) using cost-benefit techniques. Real monetary values in the table are based on a 20-year life, discounted to present value at 3% (baseline year 1988). The marginal cost and benefit figures refer to incremental costs/benefits incurred in moving from no control to Option C, from Option C to Option B, and from Option B to A respectively. A selection of the results of this analysis is presented in the following table. | (million $) Total benefits Total costs Benefit to cost ratio Marginal benefit (MB) Marginal cost (MC) MB to MC ratio Table 3 Actual BCA Table made by EPA Option B $68 957 $63 757 $6 272 $4 156 11.0 15.3 $5 192 $39 440 $2 117 $500 2.5 78.8 $24 325 $3655 6.7 $24 325 $3 665 6.67 Based on Table 3, the US Environmental Protection Agency selected Option B. Is Option B the economically efficient choice? If not, how would you justify EPA's choice of option B