

Answered step by step
Verified Expert Solution
Question
1 Approved Answer
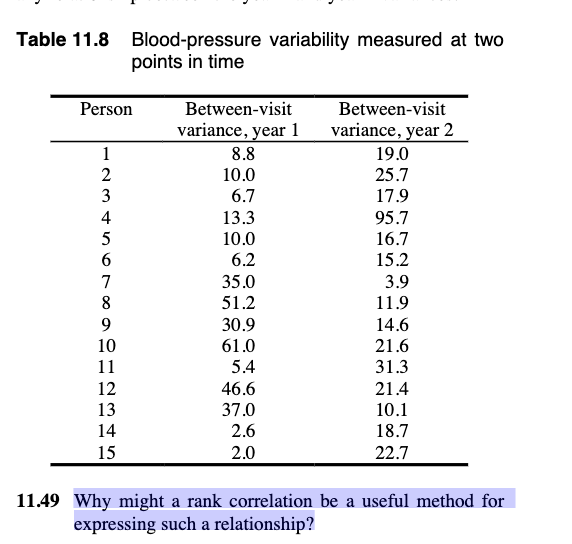
Table 11.8 Blood-pressure variability measured at two points in time Person Between-visit Between-visit variance, year 1 variance, year 2 8.8 19.0 10.0 25.7 6.7 17.9
Step by Step Solution
There are 3 Steps involved in it
Step: 1

Get Instant Access to Expert-Tailored Solutions
See step-by-step solutions with expert insights and AI powered tools for academic success
Step: 2

Step: 3
Ace Your Homework with AI
Get the answers you need in no time with our AI-driven, step-by-step assistance
Get Started
Trigonometry
Authors: Cynthia Y Young
5th Edition
1119820928, 9781119820925