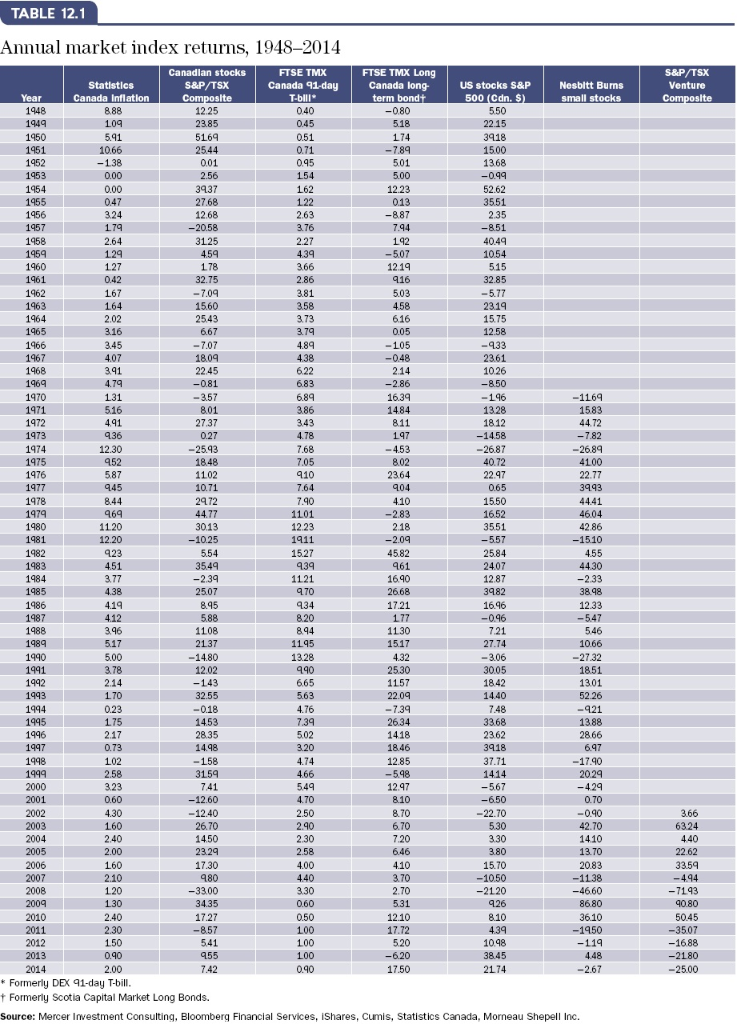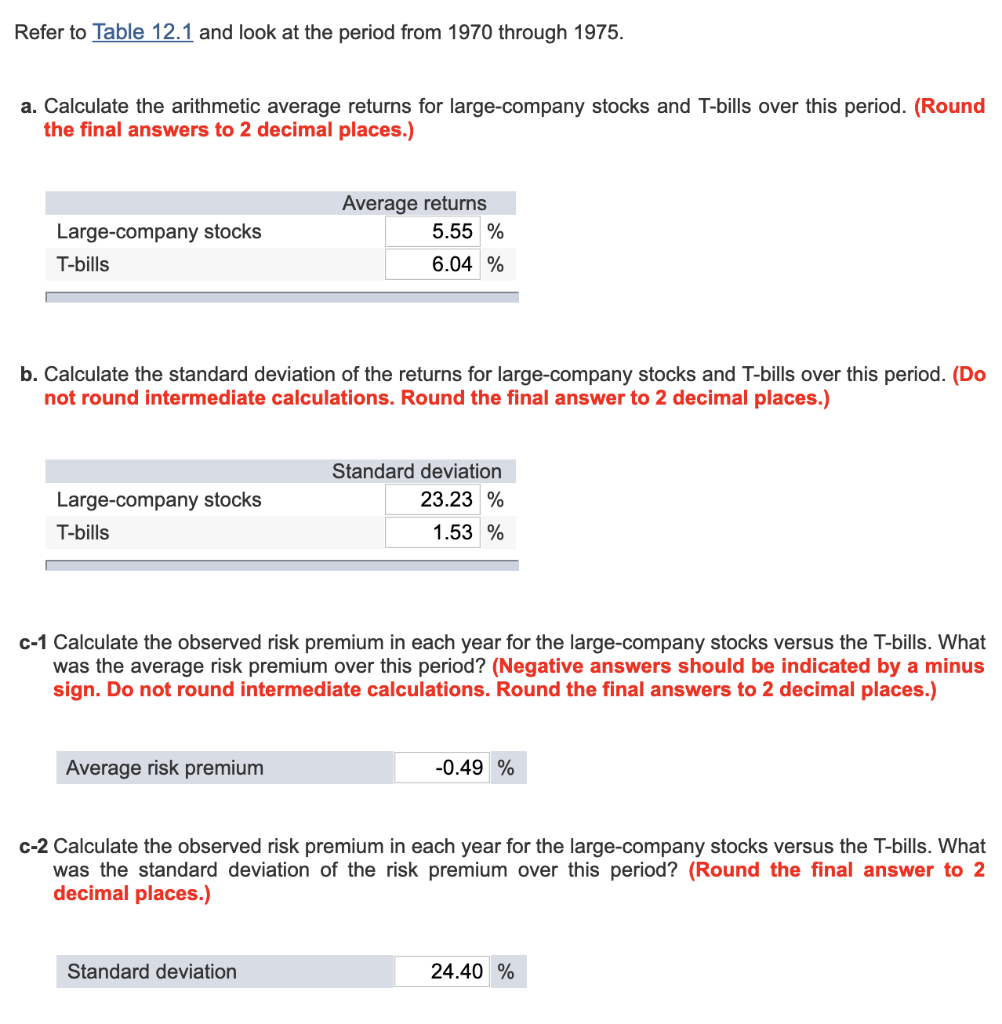

TABLE 12.1 Annual market index returns, 1948-2014 Canadlan stocks SAP/TSX FTSE TMX FTSE TMX Long S&P/TSX Statistics Canada Inflatlon Hersbltt Burms small stocks Caneda 11-day Canots long US stocks S& 789 122 3125 1959 042 3.58 2543 1583 936 1975 40.72 1979 15.27 4582 1121 3482 17.21 12.33 -0.96 2137 12.02 1851 52.26 3368 2.58 1240 26.70 -4660 8680 17.27 -3507 Formerly DEX 91-day T-bill Formerly Scotia Capital Market Long Bonds. Source: Mercer Investment Consulting, Bloomberg Financial Services, iShares, Cumis, Statistics Canada, Morneau Shepell Inc. Refer to Table 12.1 and look at the period from 1970 through 1975. a. Calculate the arithmetic average returns for large-company stocks and T-bills over this period. (Round the final answers to 2 decimal places.) Average returns Large-company stocks T-bills 5.55 % 6.04 % b. Calculate the standard deviation of the returns for large-company stocks and T-bills over this period. (Do not round intermediate calculations. Round the final answer to 2 decimal places.) Large-company stocks T-bills Standard deviation 23.23 % 1.53 % c-1 Calculate the observed risk premium in each year for the large-company stocks versus the T-bills. What was the average risk premium over this period? (Negative answers should be indicated by a minus sign. Do not round intermediate calculations. Round the final answers to 2 decimal places.) Average risk premium -0.49 % c-2 Calculate the observed risk premium in each year for the large-company stocks versus the T-bills. What was the standard deviation of the risk premium over this period? (Round the final answer to 2 decimal places.) Standard deviation 24.40 % TABLE 12.1 Annual market index returns, 1948-2014 Canadlan stocks SAP/TSX FTSE TMX FTSE TMX Long S&P/TSX Statistics Canada Inflatlon Hersbltt Burms small stocks Caneda 11-day Canots long US stocks S& 789 122 3125 1959 042 3.58 2543 1583 936 1975 40.72 1979 15.27 4582 1121 3482 17.21 12.33 -0.96 2137 12.02 1851 52.26 3368 2.58 1240 26.70 -4660 8680 17.27 -3507 Formerly DEX 91-day T-bill Formerly Scotia Capital Market Long Bonds. Source: Mercer Investment Consulting, Bloomberg Financial Services, iShares, Cumis, Statistics Canada, Morneau Shepell Inc. Refer to Table 12.1 and look at the period from 1970 through 1975. a. Calculate the arithmetic average returns for large-company stocks and T-bills over this period. (Round the final answers to 2 decimal places.) Average returns Large-company stocks T-bills 5.55 % 6.04 % b. Calculate the standard deviation of the returns for large-company stocks and T-bills over this period. (Do not round intermediate calculations. Round the final answer to 2 decimal places.) Large-company stocks T-bills Standard deviation 23.23 % 1.53 % c-1 Calculate the observed risk premium in each year for the large-company stocks versus the T-bills. What was the average risk premium over this period? (Negative answers should be indicated by a minus sign. Do not round intermediate calculations. Round the final answers to 2 decimal places.) Average risk premium -0.49 % c-2 Calculate the observed risk premium in each year for the large-company stocks versus the T-bills. What was the standard deviation of the risk premium over this period? (Round the final answer to 2 decimal places.) Standard deviation 24.40 %


