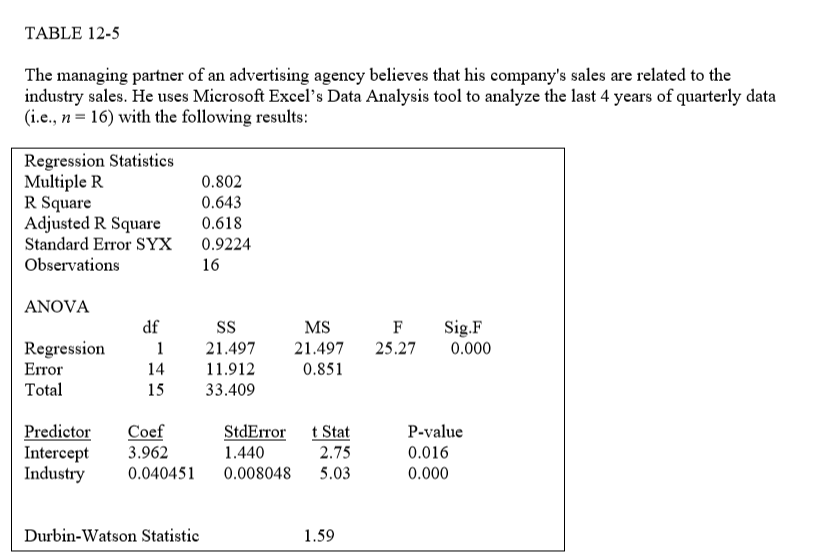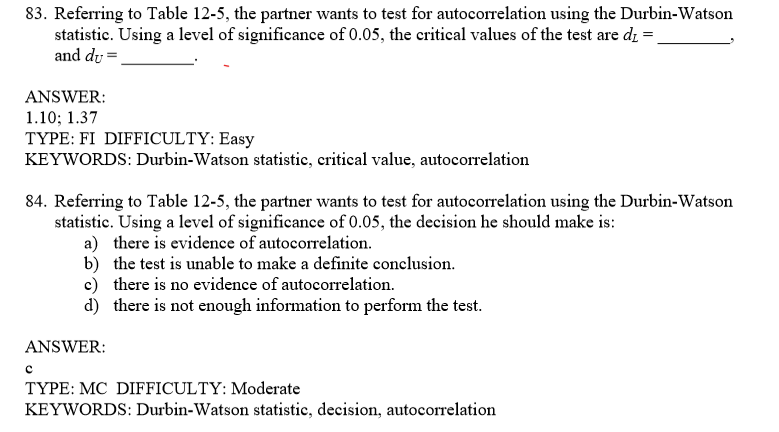

TABLE 12-5 The managing partner of an advertising agency believes that his company's sales are related to the industry sales. He uses Microsoft Excel's Data Analysis tool to analyze the last 4 years of quarterly data (i.e., n = 16) with the following results: Regression Statistics Multiple R R Square Adjusted R Square Standard Error SYX Observations 0.802 0.643 0.618 0.9224 16 ANOVA df F 25.27 Sig.F 0.000 1 MS 21.497 0.851 Regression Error Total SS 21.497 11.912 33.409 14 15 Predictor Intercept Industry Coef 3.962 0.040451 StdError 1.440 0.008048 t Stat 2.75 5.03 P-value 0.016 0.000 Durbin-Watson Statistic 1.59 83. Referring to Table 12-5, the partner wants to test for autocorrelation using the Durbin-Watson statistic. Using a level of significance of 0.05, the critical values of the test are d = and du = ANSWER: 1.10; 1.37 TYPE: FI DIFFICULTY: Easy KEYWORDS: Durbin-Watson statistic, critical value, autocorrelation 84. Referring to Table 12-5, the partner wants to test for autocorrelation using the Durbin-Watson statistic. Using a level of significance of 0.05, the decision he should make is: a) there is evidence of autocorrelation. b) the test is unable to make a definite conclusion. c) there is no evidence of autocorrelation. d) there is not enough information to perform the test. ANSWER: TYPE: MC DIFFICULTY: Moderate KEYWORDS: Durbin-Watson statistic, decision, autocorrelation TABLE 12-5 The managing partner of an advertising agency believes that his company's sales are related to the industry sales. He uses Microsoft Excel's Data Analysis tool to analyze the last 4 years of quarterly data (i.e., n = 16) with the following results: Regression Statistics Multiple R R Square Adjusted R Square Standard Error SYX Observations 0.802 0.643 0.618 0.9224 16 ANOVA df F 25.27 Sig.F 0.000 1 MS 21.497 0.851 Regression Error Total SS 21.497 11.912 33.409 14 15 Predictor Intercept Industry Coef 3.962 0.040451 StdError 1.440 0.008048 t Stat 2.75 5.03 P-value 0.016 0.000 Durbin-Watson Statistic 1.59 83. Referring to Table 12-5, the partner wants to test for autocorrelation using the Durbin-Watson statistic. Using a level of significance of 0.05, the critical values of the test are d = and du = ANSWER: 1.10; 1.37 TYPE: FI DIFFICULTY: Easy KEYWORDS: Durbin-Watson statistic, critical value, autocorrelation 84. Referring to Table 12-5, the partner wants to test for autocorrelation using the Durbin-Watson statistic. Using a level of significance of 0.05, the decision he should make is: a) there is evidence of autocorrelation. b) the test is unable to make a definite conclusion. c) there is no evidence of autocorrelation. d) there is not enough information to perform the test. ANSWER: TYPE: MC DIFFICULTY: Moderate KEYWORDS: Durbin-Watson statistic, decision, autocorrelation


