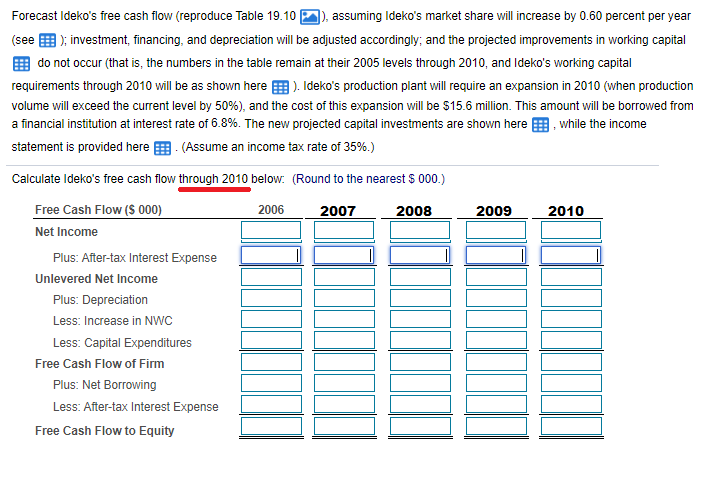
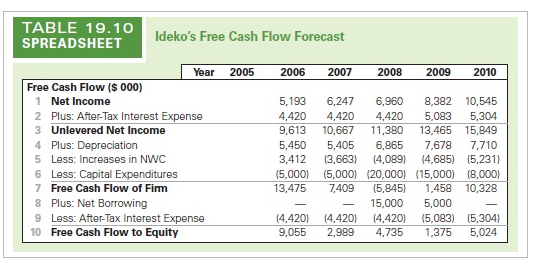
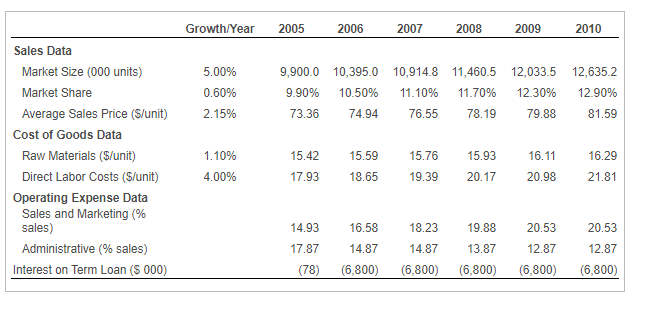
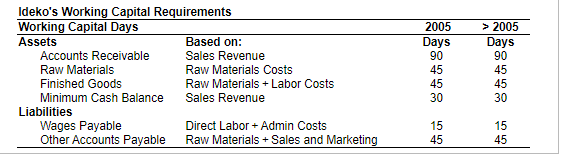
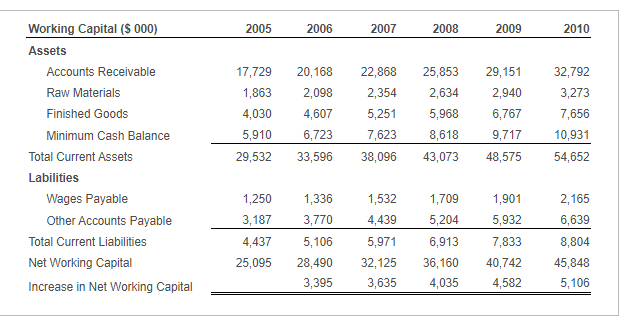
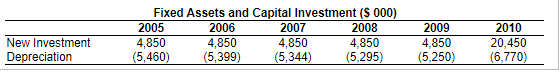
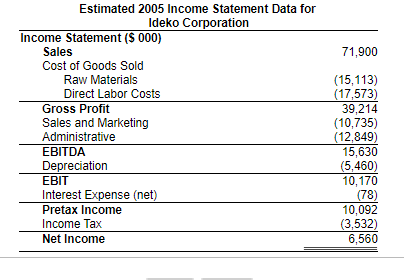
TABLE 19.10 SPREADSHEET Ideko's Free Cash Flow Forecast Year 2005 2006 2007 2008 2009 2010 Free Cash Flow ($ 000) 1 Net Income 5,193 6,247 6,960 8,382 10,545 2 Plus: After-Tax Interest Expense 4,420 4,420 4,420 5,083 5,304 3 Unlevered Net Income 9,613 10,667 11,380 13,465 15.849 4 Plus: Depreciation 5,450 5,405 6.865 7,678 7.710 5 Less: Increases in NWC 3,412 (3,663) (4,089) 14,685) (5,231) 6 Less: Capital Expenditures (5,000) (5,000) (20,000) (15,000) (8,000) 7 Free Cash Flow of Fimm 13,475 7,409 (5,845) 1,458 10,328 8 Plus: Net Borrowing 15,000 5,000 9 Less: After-Tax Interest Expense (4,420) (4,420) (4,420) (5,083) (5,304) 10 Free Cash Flow to Equity 9,055 2,989 4,735 1,375 5,024 Growth/Year 2005 2006 2007 2008 2009 2010 5.00% 0.60% 2.15% 9,900.0 10,395.0 10,914.8 11,460.5 12,033.5 12,635.2 9.90% 10.50% 11.10% 11.70% 12.30% 12.90% 73.36 74.94 76.55 78.19 79.88 81.59 15.93 16.29 Sales Data Market Size (000 units) Market Share Average Sales Price (S/unit) Cost of Goods Data Raw Materials ($/unit) Direct Labor Costs (S/unit) Operating Expense Data Sales and Marketing (% sales) Administrative % sales) Interest on Term Loan (3 000) 1.10% 4.00% 15.42 17.93 15.59 18.65 15.76 19.39 16.11 20.98 20.17 21.81 14.93 16.58 18.23 19.88 20.53 17.87 14.87 (6,800) 14.87 (6,800) 13.87 (6,800) 20.53 12.87 (6,800) 12.87 (6,800) (78) Ideko's Working Capital Requirements Working Capital Days Assets Based on: Accounts Receivable Sales Revenue Raw Materials Raw Materials Costs Finished Goods Raw Materials + Labor Costs Minimum Cash Balance Sales Revenue Liabilities Wages Payable Direct Labor + Admin Costs Other Accounts Payable Raw Materials + Sales and Marketing 2005 Days 90 45 45 30 > 2005 Days 90 45 45 30 15 45 15 45 Working Capital ($ 000) 2005 2006 2007 2008 2009 2010 Assets 17,729 1,863 4,030 5,910 29,532 20,168 2,098 4,607 6,723 33,596 22,868 2,354 5,251 7,623 38,096 25,853 2,634 5,968 8,618 43,073 29,151 2,940 6,767 9,717 48,575 32,792 3,273 7,656 10,931 54,652 Accounts Receivable Raw Materials Finished Goods Minimum Cash Balance Total Current Assets Labilities Wages Payable Other Accounts Payable Total Current Liabilities Net Working Capital Increase in Net Working Capital 1,250 3,187 4,437 25,095 1,336 3,770 5,106 28,490 3,395 1,532 4,439 5,971 32,125 3,635 1,709 5,204 6,913 36,160 4,035 1,901 5,932 7,833 40,742 4,582 2,165 6,639 8,804 45,848 5,106 Fixed Assets and Capital Investment (S 000) 2005 2006 2007 2008 4,850 4,850 4,850 4,850 (5,460) (5,399) (5,344) (5,295) New Investment Depreciation 2009 4,850 (5,250) 2010 20,450 (6,770) 71,900 Estimated 2005 Income Statement Data for Ideko Corporation Income Statement ($ 000) Sales Cost of Goods Sold Raw Materials Direct Labor Costs Gross Profit Sales and Marketing Administrative EBITDA Depreciation EBIT Interest Expense (net) Pretax Income Income Tax Net Income (15,113) (17,573) 39,214 (10,735) (12,849) 15,630 (5,460) 10,170 (78) 10,092 (3,532) 6,560 TABLE 19.10 SPREADSHEET Ideko's Free Cash Flow Forecast Year 2005 2006 2007 2008 2009 2010 Free Cash Flow ($ 000) 1 Net Income 5,193 6,247 6,960 8,382 10,545 2 Plus: After-Tax Interest Expense 4,420 4,420 4,420 5,083 5,304 3 Unlevered Net Income 9,613 10,667 11,380 13,465 15.849 4 Plus: Depreciation 5,450 5,405 6.865 7,678 7.710 5 Less: Increases in NWC 3,412 (3,663) (4,089) 14,685) (5,231) 6 Less: Capital Expenditures (5,000) (5,000) (20,000) (15,000) (8,000) 7 Free Cash Flow of Fimm 13,475 7,409 (5,845) 1,458 10,328 8 Plus: Net Borrowing 15,000 5,000 9 Less: After-Tax Interest Expense (4,420) (4,420) (4,420) (5,083) (5,304) 10 Free Cash Flow to Equity 9,055 2,989 4,735 1,375 5,024 Growth/Year 2005 2006 2007 2008 2009 2010 5.00% 0.60% 2.15% 9,900.0 10,395.0 10,914.8 11,460.5 12,033.5 12,635.2 9.90% 10.50% 11.10% 11.70% 12.30% 12.90% 73.36 74.94 76.55 78.19 79.88 81.59 15.93 16.29 Sales Data Market Size (000 units) Market Share Average Sales Price (S/unit) Cost of Goods Data Raw Materials ($/unit) Direct Labor Costs (S/unit) Operating Expense Data Sales and Marketing (% sales) Administrative % sales) Interest on Term Loan (3 000) 1.10% 4.00% 15.42 17.93 15.59 18.65 15.76 19.39 16.11 20.98 20.17 21.81 14.93 16.58 18.23 19.88 20.53 17.87 14.87 (6,800) 14.87 (6,800) 13.87 (6,800) 20.53 12.87 (6,800) 12.87 (6,800) (78) Ideko's Working Capital Requirements Working Capital Days Assets Based on: Accounts Receivable Sales Revenue Raw Materials Raw Materials Costs Finished Goods Raw Materials + Labor Costs Minimum Cash Balance Sales Revenue Liabilities Wages Payable Direct Labor + Admin Costs Other Accounts Payable Raw Materials + Sales and Marketing 2005 Days 90 45 45 30 > 2005 Days 90 45 45 30 15 45 15 45 Working Capital ($ 000) 2005 2006 2007 2008 2009 2010 Assets 17,729 1,863 4,030 5,910 29,532 20,168 2,098 4,607 6,723 33,596 22,868 2,354 5,251 7,623 38,096 25,853 2,634 5,968 8,618 43,073 29,151 2,940 6,767 9,717 48,575 32,792 3,273 7,656 10,931 54,652 Accounts Receivable Raw Materials Finished Goods Minimum Cash Balance Total Current Assets Labilities Wages Payable Other Accounts Payable Total Current Liabilities Net Working Capital Increase in Net Working Capital 1,250 3,187 4,437 25,095 1,336 3,770 5,106 28,490 3,395 1,532 4,439 5,971 32,125 3,635 1,709 5,204 6,913 36,160 4,035 1,901 5,932 7,833 40,742 4,582 2,165 6,639 8,804 45,848 5,106 Fixed Assets and Capital Investment (S 000) 2005 2006 2007 2008 4,850 4,850 4,850 4,850 (5,460) (5,399) (5,344) (5,295) New Investment Depreciation 2009 4,850 (5,250) 2010 20,450 (6,770) 71,900 Estimated 2005 Income Statement Data for Ideko Corporation Income Statement ($ 000) Sales Cost of Goods Sold Raw Materials Direct Labor Costs Gross Profit Sales and Marketing Administrative EBITDA Depreciation EBIT Interest Expense (net) Pretax Income Income Tax Net Income (15,113) (17,573) 39,214 (10,735) (12,849) 15,630 (5,460) 10,170 (78) 10,092 (3,532) 6,560