

Answered step by step
Verified Expert Solution
Question
1 Approved Answer
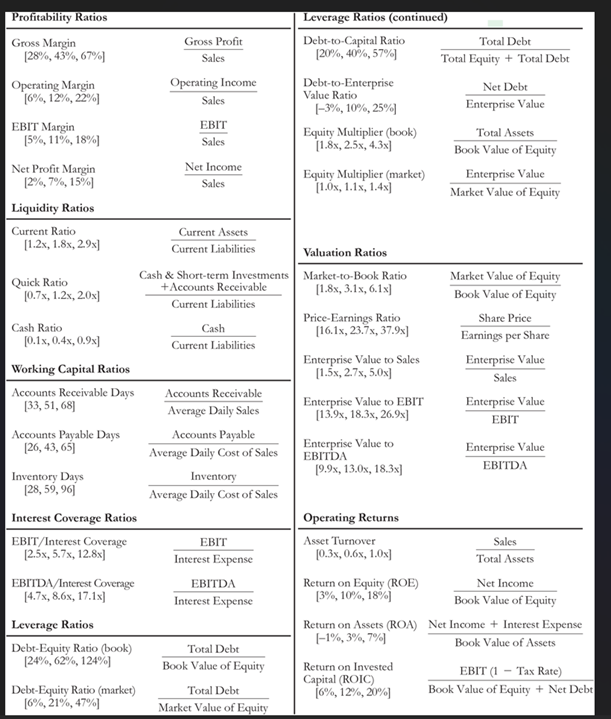
Table 2 . 4 Key Financial Ratios for Large U . S . Firms, Spring 2 0 1 8 ( Data shows quartiles [ 2
Table
Key Financial Ratios for Large US Firms, Spring Data shows quartiles median, for US stocks with market capitalization over $ billion
Question
Table in Berk and DeMarzo provide key financial ratios for large US firms updated in Spring of Within this table, the authors highlight the median, and quartiles for each type of ratio. Using examples of firms, explain why there are significant differences between the and quartiles for large companies specifically focusing on the Net Profit Margin, Asset Turnover, and the Equity Multiplier. How would you explain the differences between firms in the lower and upper quartiles hint: see the DuPont identity for guidance Include at least two citations that support your response.
Step by Step Solution
There are 3 Steps involved in it
Step: 1

Get Instant Access to Expert-Tailored Solutions
See step-by-step solutions with expert insights and AI powered tools for academic success
Step: 2

Step: 3
Ace Your Homework with AI
Get the answers you need in no time with our AI-driven, step-by-step assistance
Get Started
All About Options
Authors: Thomas McCafferty
3rd Edition
0071484795, 978-0071484794