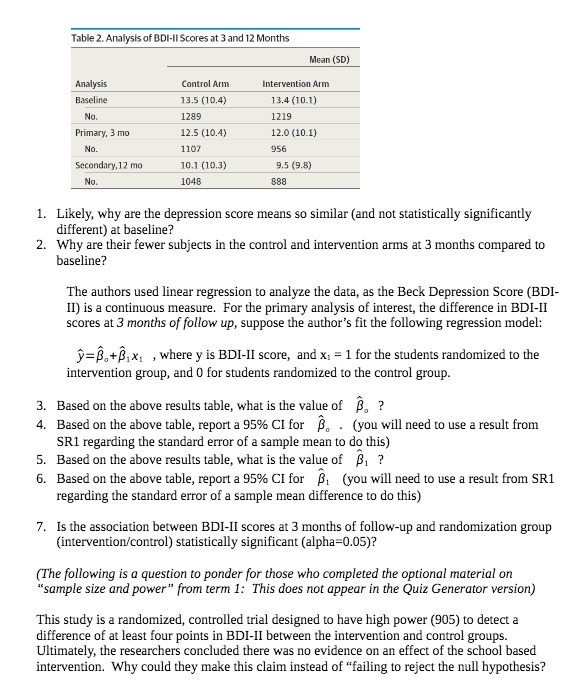
Table 2. Analysis of BDI-II Scores at 3 and 12 Months Mean (SD) Analysis Control Arm Intervention Arm Baseline 13.5 (10.4) 13.4 (10.1) No. 1289 1219 Primary, 3 mo 12.5 (10.4) 12.0 (10.1) No. 110 956 Secondary, 12 mo 10.1 (10.3) 9.5 (9.5) No. 1048 888 1. Likely, why are the depression score means so similar (and not statistically significantly different) at baseline? 2. Why are their fewer subjects in the control and intervention arms at 3 months compared to baseline? The authors used linear regression to analyze the data, as the Beck Depression Score (BDI- II) is a continuous measure. For the primary analysis of interest, the difference in BDI-II scores at 3 months of follow up, suppose the author's fit the following regression model: y=p.+pix , where y is BDI-II score, and x1 = 1 for the students randomized to the intervention group, and 0 for students randomized to the control group. 3. Based on the above results table, what is the value of P. ? 4. Based on the above table, report a 95% CI for . . (you will need to use a result from SR1 regarding the standard error of a sample mean to do this) 5. Based on the above results table, what is the value of P, ? 6. Based on the above table, report a 95% CI for , (you will need to use a result from SR1 regarding the standard error of a sample mean difference to do this) 7. Is the association between BDI-II scores at 3 months of follow-up and randomization group (intervention/control) statistically significant (alpha=0.05)? (The following is a question to ponder for those who completed the optional material on "sample size and power" from term 1: This does not appear in the Quiz Generator version) This study is a randomized, controlled trial designed to have high power (905) to detect a difference of at least four points in BDI-II between the intervention and control groups. Ultimately, the researchers concluded there was no evidence on an effect of the school based intervention. Why could they make this claim instead of "failing to reject the null hypothesis