Answered step by step
Verified Expert Solution
Question
1 Approved Answer
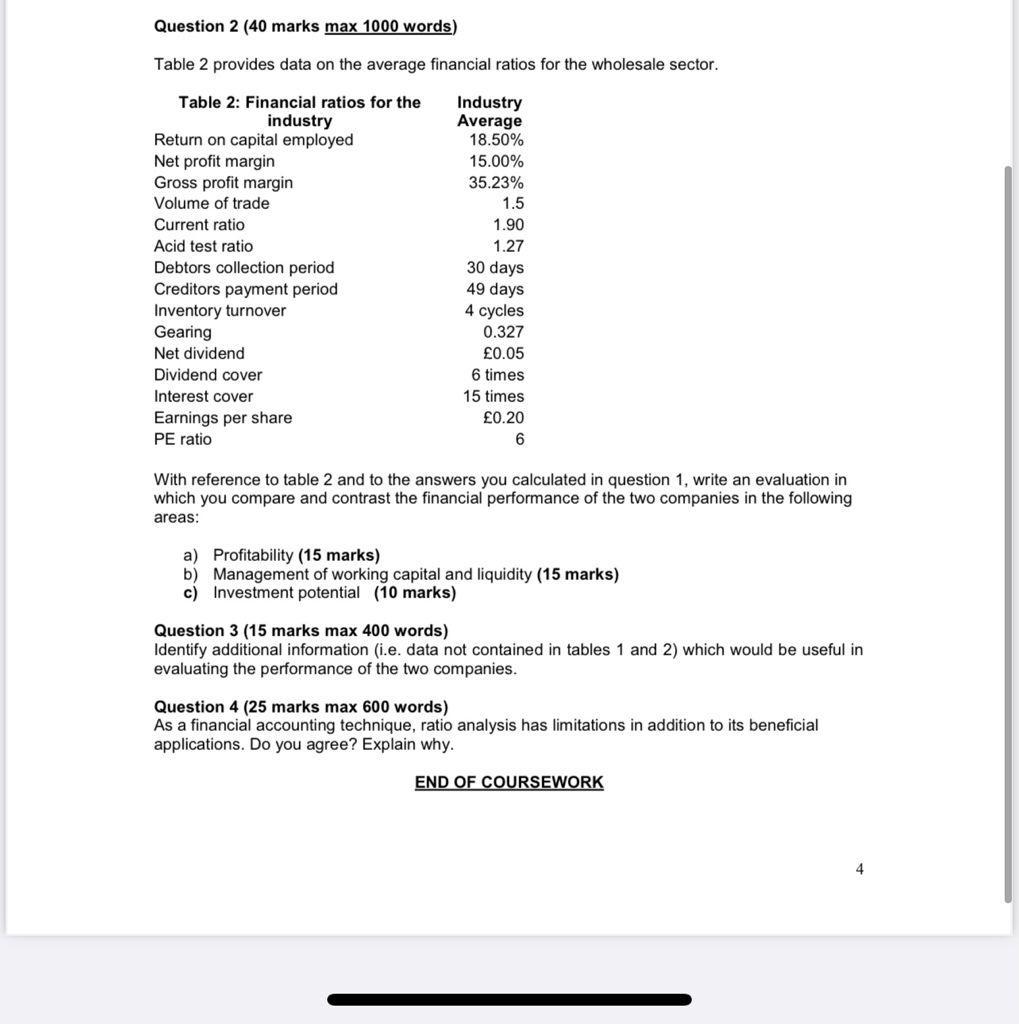
Question 2 (40 marks max 1000 words) Table 2 provides data on the average financial ratios for the wholesale sector. Table 2: Financial ratios

Question 2 (40 marks max 1000 words) Table 2 provides data on the average financial ratios for the wholesale sector. Table 2: Financial ratios for the industry Return on capital employed Net profit margin Gross profit margin Volume of trade Current ratio Acid test ratio Debtors collection period Creditors payment period Inventory turnover Gearing Net dividend Dividend cover Interest cover Earnings per share PE ratio Industry Average 18.50% 15.00% 35.23% 1.5 1.90 1.27 30 days 49 days 4 cycles 0.327 0.05 6 times 15 times 0.20 6 With reference to table 2 and to the answers you calculated in question 1, write an evaluation in which you compare and contrast the financial performance of the two companies in the following areas: a) Profitability (15 marks) b) Management of working capital and liquidity (15 marks) c) Investment potential (10 marks) Question 3 (15 marks max 400 words) Identify additional information (i.e. data not contained in tables 1 and 2) which would be useful in evaluating the performance of the two companies. Question 4 (25 marks max 600 words) As a financial accounting technique, ratio analysis has limitations in addition to its beneficial applications. Do you agree? Explain why. END OF COURSEWORK
Step by Step Solution
★★★★★
3.55 Rating (148 Votes )
There are 3 Steps involved in it
Step: 1
The two companies differ in terms of profitability with Company A having a higher return on capital employed ROCE and net profit margin than Company B However Company B has a higher gross profit margi...
Get Instant Access to Expert-Tailored Solutions
See step-by-step solutions with expert insights and AI powered tools for academic success
Step: 2

Step: 3

Ace Your Homework with AI
Get the answers you need in no time with our AI-driven, step-by-step assistance
Get Started


