Answered step by step
Verified Expert Solution
Question
1 Approved Answer
Table 2. Micro amps Voltage Control Knob Position Voltage (V) Current (1) 9:00 1 888 V 1. 9 microamps 10:30 2 2. 9 V 6.
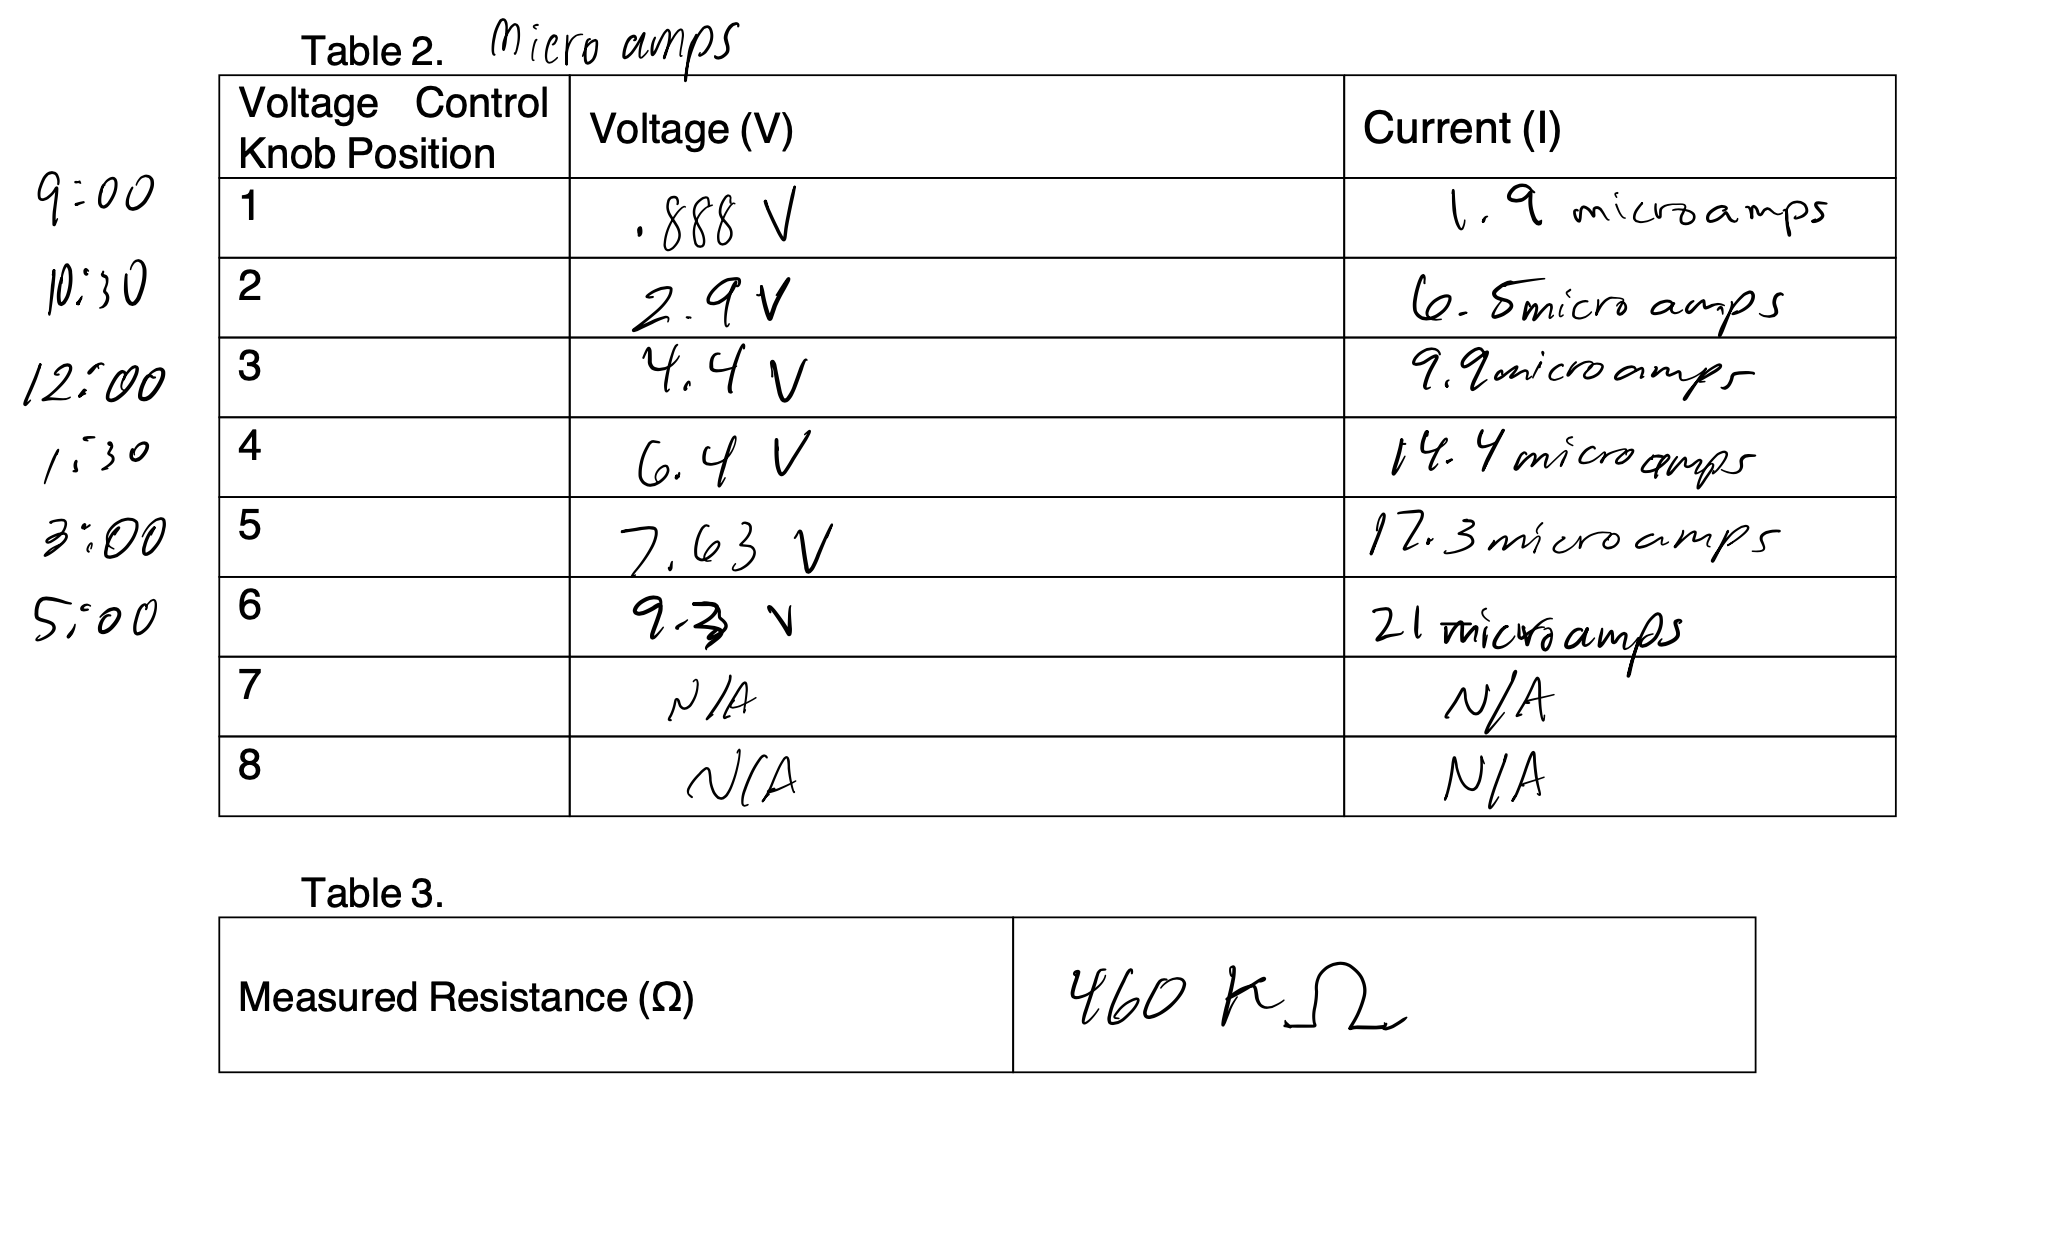
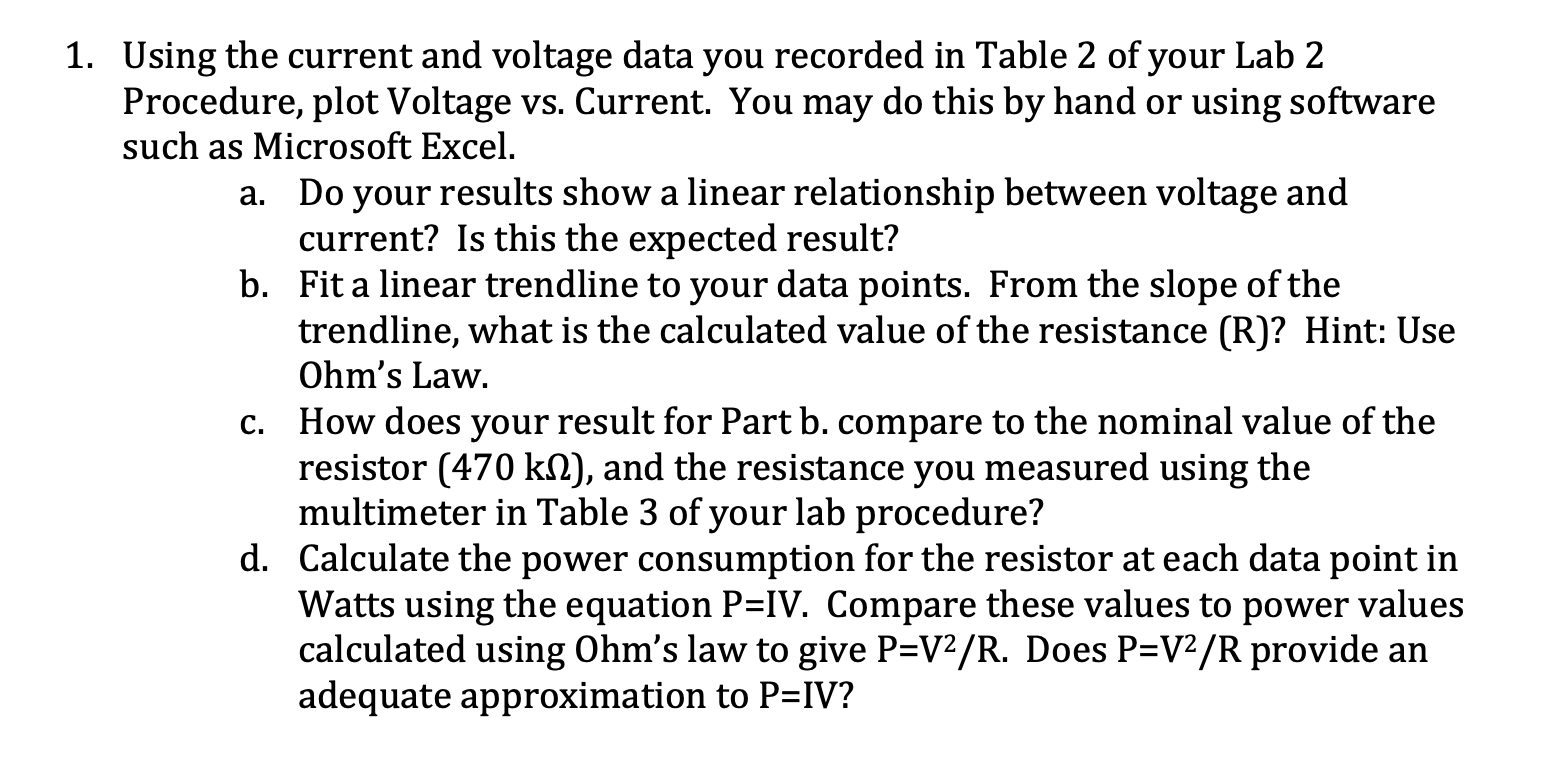
Table 2. Micro amps Voltage Control Knob Position Voltage (V) Current (1) 9:00 1 888 V 1. 9 microamps 10:30 2 2. 9 V 6. Smicro amps 12500 3 4. 4 V 9. Zanicro amps 1:30 4 6.4 V 14. 4 microamps 3:00 5 7.63 V 17.3 microamps 5:00 6 9 . 3 V 21 micro amps 7 N/A N / A 8 NCA N/A Table 3. Measured Resistance (Q) 460 Kn. Using the current and voltage data you recorded in Table 2 of your Lab 2 Procedure, plot Voltage vs. Current. You may do this by hand or using software such as Microsoft Excel. a. Do your results show a linear relationship between voltage and current? Is this the expected result? b. Fit a linear trendline to your data points. From the slope of the trendline, what is the calculated value of the resistance (R)? Hint: Use Ohm's Law. c. How does your result for Part b. compare to the nominal value of the resistor [470 km, and the resistance you measured using the multimeter in Table 3 of your lab procedure? d. Calculate the power consumption for the resistor at each data point in Watts using the equation P=IV. Compare these values to power values calculated using Ohm's law to give P=V2/ R. Does P=V2 / R provide an adequate approximation to P=IV
Step by Step Solution
There are 3 Steps involved in it
Step: 1
Get Instant Access to Expert-Tailored Solutions
See step-by-step solutions with expert insights and AI powered tools for academic success
Step: 2
Step: 3
Ace Your Homework with AI
Get the answers you need in no time with our AI-driven, step-by-step assistance
Get Started