Question
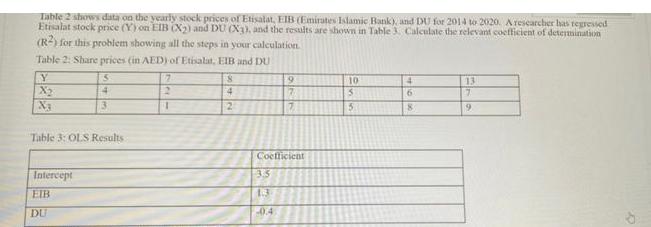
Table 2 shows data on the yearly stock prices of Etisalat, EIB (Emirates Islamic Bank), and DU for 2014 to 2020. A researcher has

Table 2 shows data on the yearly stock prices of Etisalat, EIB (Emirates Islamic Bank), and DU for 2014 to 2020. A researcher has regressed Etisalat stock price (Y) on EIB (X2) and DU (X3), and the results are shown in Table 3. Calculate the relevant coefficient of determination (R2) for this problem showing all the steps in your calculation. Table 2: Share prices (in AED) of Etisalat, EIB and DU Y X 5 Intercept EIB DU 4 3 Table 3: OLS Results 7 2 1 8 4 2 9 7 3.3 1.3 -0.4 7 Coefficient 10 5 5 4 6 8 13 7 19
Step by Step Solution
3.47 Rating (157 Votes )
There are 3 Steps involved in it
Step: 1
To calculate the coefficient of determination R2 for the regression of Etisalat stock price V on EIB ...
Get Instant Access to Expert-Tailored Solutions
See step-by-step solutions with expert insights and AI powered tools for academic success
Step: 2

Step: 3

Ace Your Homework with AI
Get the answers you need in no time with our AI-driven, step-by-step assistance
Get StartedRecommended Textbook for
Microeconomics
Authors: Paul Krugman, Robin Wells
3rd edition
978-1429283427, 1429283424, 978-1464104213, 1464104212, 978-1429283434
Students also viewed these Finance questions
Question
Answered: 1 week ago
Question
Answered: 1 week ago
Question
Answered: 1 week ago
Question
Answered: 1 week ago
Question
Answered: 1 week ago
Question
Answered: 1 week ago
Question
Answered: 1 week ago
Question
Answered: 1 week ago
Question
Answered: 1 week ago
Question
Answered: 1 week ago
Question
Answered: 1 week ago
Question
Answered: 1 week ago
Question
Answered: 1 week ago
Question
Answered: 1 week ago
Question
Answered: 1 week ago
Question
Answered: 1 week ago
Question
Answered: 1 week ago
Question
Answered: 1 week ago
Question
Answered: 1 week ago
Question
Answered: 1 week ago
Question
Answered: 1 week ago
View Answer in SolutionInn App


