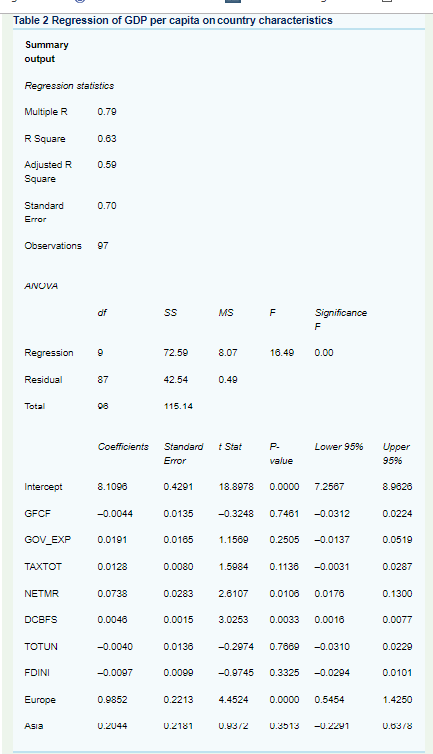
Table 2 shows the results for a regression of GDP per capita (log) on seven variables at the country level. Table 2 Regression of GDP
Table 2 shows the results for a regression of GDP per capita (log) on seven variables at the country level.


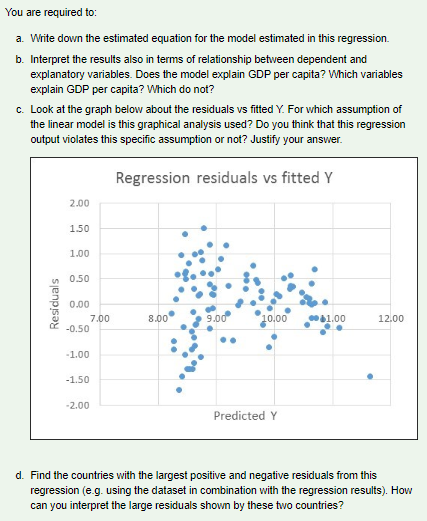
Table 2 Regression of GDP per capita on country characteristics Summary output Regression statistics Multiple R R Square Adjusted R Square Standard Error ANOVA Regression Residual Observations 97 Total Intercept GFCF TAXTOT NETMR DCBFS TOTUN FDINI 0.79 Europe 0.63 Asia 0.59 0.70 dif GOV_EXP 0.0191 87 98 8.1098 -0.0044 0.0128 0.0738 0.0046 Coefficients Standard t Stat Error -0.0040 -0.0097 0.9852 SS 0.2044 72.59 42.54 115.14 0.4291 0.0135 0.0165 0.0080 0.0283 0.0015 0.0099 MS 0.2213 8.07 0.2181 0.49 18.8978 1.1569 0.0136 -0.2974 2.6107 3.0253 F -0.9745 16.49 1.5984 0.1136 P- value 0.93/2 0.0000 -0.3248 0.7461 -0.0312 0.2505 Significance F 0.00 Lower 95% 7.2567 -0.0137 -0.0031 0.0106 0.0176 0.0033 0.0016 0.7669 -0.0310 0.3325 -0.0294 4.4524 0.0000 0.5454 0.3513 -0.2291 1 Upper 95% 8.9828 0.0224 0.0519 0.0287 0.1300 0.0077 0.0229 0.0101 1.4250 0.63/8 You are required to: a. Write down the estimated equation for the model estimated in this regression. b. Interpret the results also in terms of relationship between dependent and explanatory variables. Does the model explain GDP per capita? Which variables explain GDP per capita? Which do not? c. Look at the graph below about the residuals vs fitted Y. For which assumption of the linear model is this graphical analysis used? Do you think that this regression output violates this specific assumption or not? Justify your answer. Regression residuals vs fitted Y Residuals 2.00 1.50 1.00 0.50 0.00 7.00 -0.50 -1.00 -1.50 -2.00 $4 8.00 9.00 10,00 Predicted Y $1.00 12.00 d. Find the countries with the largest positive and negative residuals from this regression (e.g. using the dataset in combination with the regression results). How can you interpret the large residuals shown by these two countries?
Step by Step Solution
3.43 Rating (153 Votes )
There are 3 Steps involved in it
Step: 1
There are 9 variables in the model athe regression equation ...
See step-by-step solutions with expert insights and AI powered tools for academic success
Step: 2

Step: 3

Ace Your Homework with AI
Get the answers you need in no time with our AI-driven, step-by-step assistance
Get Started


