

Answered step by step
Verified Expert Solution
Question
1 Approved Answer
Table 2 shows UK sales of a particular model of car over three years (figures in 100,000 units). a) Use the technique of moving averages
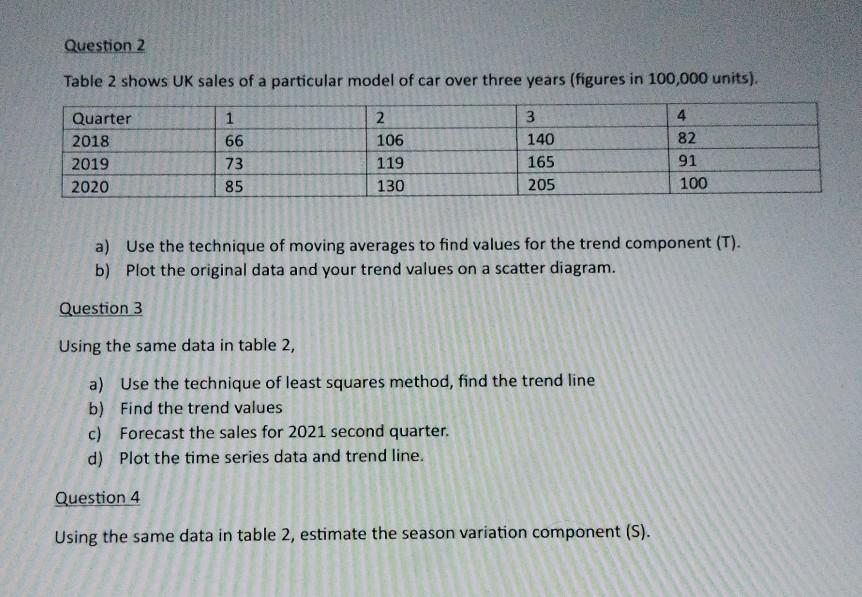
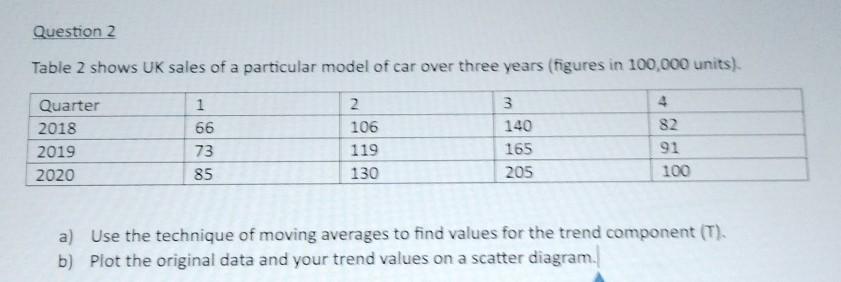
Table 2 shows UK sales of a particular model of car over three years (figures in 100,000 units). a) Use the technique of moving averages to find values for the trend component (T). b) Plot the original data and your trend values on a scatter diagram. Question 3 Using the same data in table 2 , a) Use the technique of least squares method, find the trend line b) Find the trend values c) Forecast the sales for 2021 second quarter. d) Plot the time series data and trend line. Question 4 Using the same data in table 2 , estimate the season variation component (S). Table 2 shows UK sales of a particular model of car over three years (figures in 100,000 units). a) Use the technique of moving averages to find values for the trend component (T). b) Plot the original data and your trend values on a scatter diagram
Step by Step Solution
There are 3 Steps involved in it
Step: 1

Get Instant Access to Expert-Tailored Solutions
See step-by-step solutions with expert insights and AI powered tools for academic success
Step: 2

Step: 3
Ace Your Homework with AI
Get the answers you need in no time with our AI-driven, step-by-step assistance
Get Started
Value Investing
Authors: Mike Hartley
1st Edition
979-8864443309