

Answered step by step
Verified Expert Solution
Question
1 Approved Answer
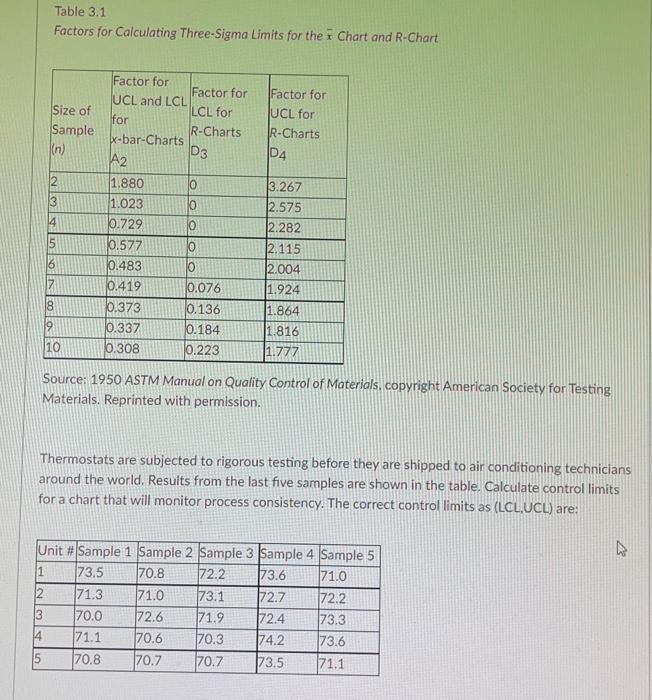
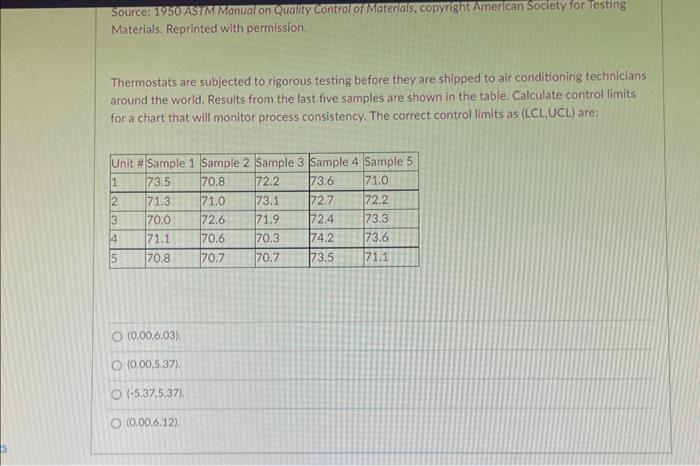
Table 3.1 Factors for Calculating Three-Sigma Limits for the x Chart and R-Chart Source: 1950 ASTM Manual on Quality Control of Materials. copyright American Society
Step by Step Solution
There are 3 Steps involved in it
Step: 1

Get Instant Access to Expert-Tailored Solutions
See step-by-step solutions with expert insights and AI powered tools for academic success
Step: 2

Step: 3
Ace Your Homework with AI
Get the answers you need in no time with our AI-driven, step-by-step assistance
Get Started
Handbook Of Key Global Financial Markets Institutions And Infrastructure
Authors: Gerard Caprio
1st Edition
0123978734, 9780123978738