Table 3.1 presents R&E Supplies' financial statements for the period 2014 through 2017, and Table 3.5 presents a pro forma financial forecast for 2018. Use the information in these tables to answer the following questions. a. Calculate R&E's sustainable growth rate in each year from 2015 through 2018. Assume the dividend payout ratio was the same in 2015-17 as forecasted in 2018. (Round your answers to 1 decimal place.)
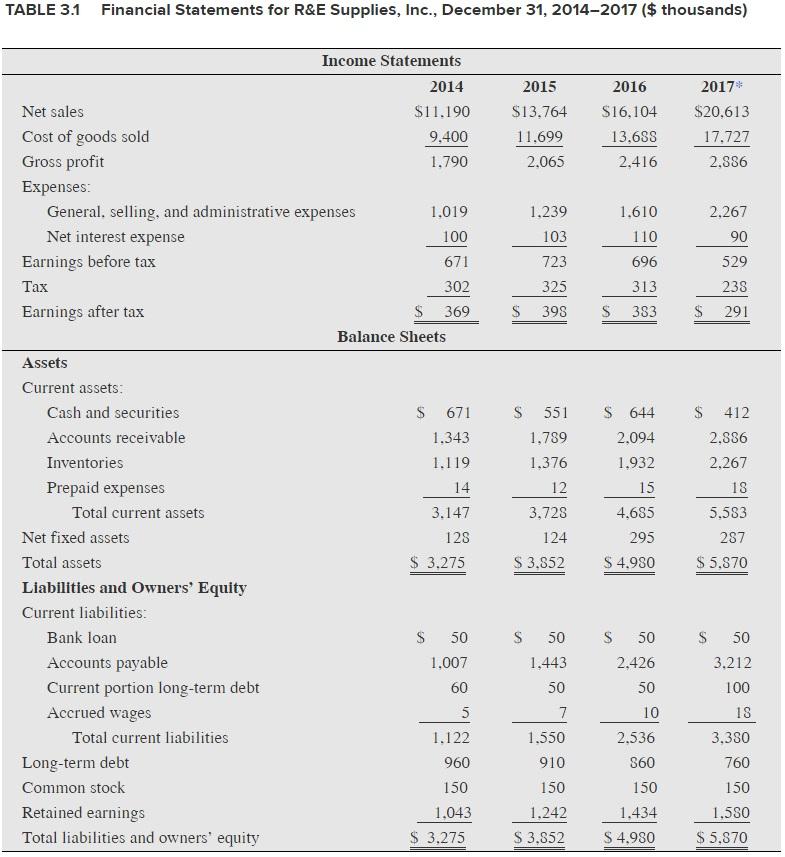
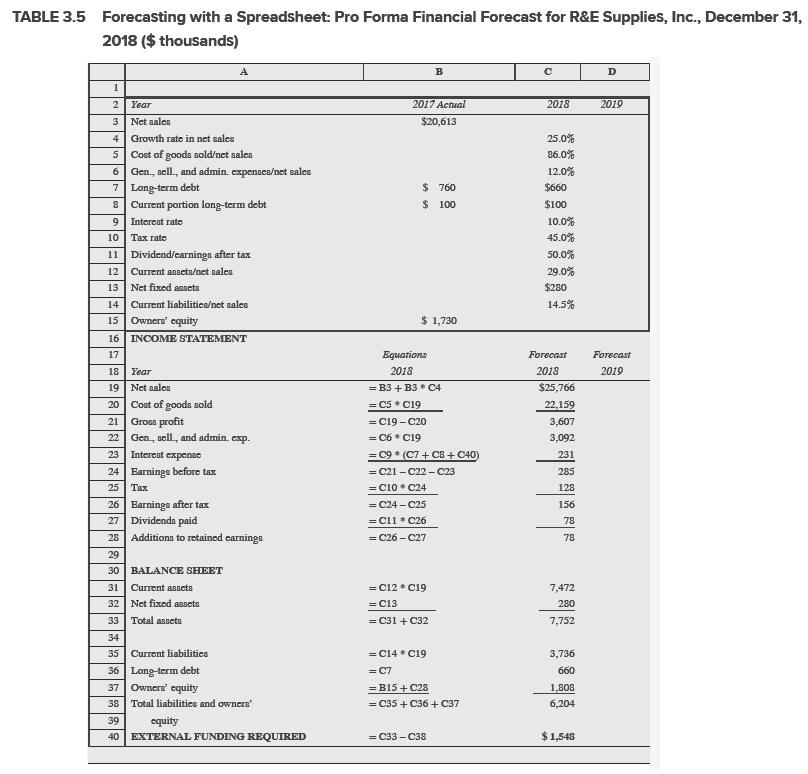
TABLE 3.1 Financial Statements for R&E Supplies, Inc., December 31, 2014-2017 ($ thousands) 2017 2015 $13.764 11.699 2.065 2016 $16.104 13,6SS 2,416 $20.613 17.727 2.886 1.239 1.610 110 696 2,267 90 103 723 529 238 325 313 $ 398 S 383 $ 291 S 551 $ 412 Income Statements 2014 Net sales $11.190 Cost of goods sold 9,400 Gross profit 1.790 Expenses: General, selling, and administrative expenses 1,019 Net interest expense 100 Earnings before tax 671 Tax 302 Earnings after tax S 369 Balance Sheets Assets Current assets: Cash and securities S 671 Accounts receivable 1.343 Inventories 1.119 Prepaid expenses 14 Total current assets 3.147 Net fixed assets 128 Total assets $ 3.275 Liabilities and Owners' Equity Current liabilities: Bank loan S 50 Accounts payable 1.007 Current portion long-term debt 60 Accrued wages 5 Total current liabilities 1.122 Long-term debt 960 Common stock 150 Retained earnings 1.043 Total liabilities and owners' equity $ 3,275 1,789 1.376 2.886 2.267 S 644 2.094 1.932 15 4,685 295 18 12 3,728 5.583 124 287 $ 3.852 S 4.980 $ 5.870 S 50 2.426 50 S 50 1.443 50 7 1.550 910 150 1.242 S 3.852 S 50 3.212 100 18 3,380 760 10 2.536 860 150 1.434 150 1.580 $ 5.870 $ 4.980 TABLE 3.5 Forecasting with a Spreadsheet: Pro Forma Financial Forecast for R&E Supplies, Inc., December 31, 2018 ($ thousands) A B C D 1 2018 2079 2017 Actual $20,613 3 2 Year Net salon 4 Growth rate in net sales 5 Cost of goods sold net sales 6 Gen., sell, and admin. expenecaet sales 7 Long-term debt 8 Current portion long-term debt $ 760 $ 100 9 Interest rate 10 Tax rate 25.0% 86.0% 12.0% $660 $100 10.0% 45.0% 50.0% 29.0% $280 14.5% 12 13 11 Dividend/earnings after tax Current aractaet sales Net fixed assets Current liabiliticaet sales Owners' equity 16 INCOME STATEMENT 14 15 $ 1,730 17 Forecast 2019 Equations 2018 =B3 + B3 * C4 = C5 C19 =C19-20 =C6 * 019 =C9* (C7+ C8 + C40 =C21-C22-C23 =C10*C24 =C24-25 =C11C26 =C26 - C27 Forecast 2018 $25,766 22,159 3,607 3,092 231 285 128 156 78 Tax 78 18 Year 19 Net sales 20 Coat of goods sold 21 Gross profit 22 Gen., sell, and admin. exp. 23 Interest expense 24 Barninga before tax 25 26 Earnings after tax 27 Dividenda paid 28 Addition to retained carninge 29 30 BALANCE SHEET 31 Current assets 32 Net fixed assets 33 Total assets 34 35 Current liabilities 36 Long-term debt 37 Owners' equity 38 Total liabilities and owners' 39 equity 40 EXTERNAL FUNDING REQUIRED =C12C19 =C13 =C31 +32 7,472 280 7,752 3,736 660 =C14 019 =C7 =B15 + C28 =C35 + C36 +237 1,808 6,204 =C33-038 $ 1,548